SigNoz is an open-source observability platform that integrates metrics, traces, and logs into a single pane of glass. By leveraging high-performance storage and standardized ingestion, it provides an alternative to traditional SaaS vendors without the constraints of proprietary lock-in.
This guide provides a conceptual and structural walkthrough to taking SigNoz from an initial idea to a production-ready deployment.
Part 1: Architecture & Data Philosophy
1.1 Understanding the Data Flow
Success with SigNoz begins with understanding how data moves through the system. Unlike traditional monitoring where an app might talk directly to a dashboard, SigNoz uses a decoupled architecture to ensure resilience:
- Telemetry Generation: The application produces data points (traces, metrics, logs) using standardized protocols.
- The Processing Layer: A central collector receives this raw data, filters out noise, and ensures it is formatted correctly before storage.
- Storage Engine: Data is stored in a high-performance database optimized for large-scale analytical queries.
- Visualization Layer: The user interface queries the storage engine to represent the data visually.
1.2 Deployment Strategy
Choosing between Docker and Kubernetes is less about the technical commands and more about the scale of your organization.
- Small-Scale/Testing: Simplified containers are ideal for local debugging or small, isolated environments where high availability is not a primary concern.
- Production/Enterprise: Orchestration platforms like Kubernetes are preferred for their ability to handle resource isolation, automatic scaling, and persistence of data across hardware failures.
Part 2: Connectivity via Runtime Configuration
The most significant advantage of modern observability is Zero-Code Instrumentation. This allows teams to connect services to SigNoz without modifying the application's source code.
2.1 The "Config-Only" Approach
For established services, the connection is established entirely through the runtime environment. By leveraging the service's configuration file, you can "hook" into the application at the startup level.
- Runtime Interception: By adding specific flags to your service's startup options (such as Java's javaagent), you allow the observability engine to listen to the application's internal behavior, like database calls or external API requests, automatically.
- Environment Mapping: By adding destination endpoints and service identifiers to your environment variable list, you define the path the data takes to reach SigNoz.
2.2 Standardizing Metadata
For observability to be useful across multiple teams, metadata must be standardized. Every service should share a common language regarding its name, its version, and the environment it lives in. This consistency allows the system to correlate a performance dip in one service with a deployment event in another.
Part 3: The Theory of Custom Metrics
Standard monitoring shows you if a server is "up," but custom metrics show you if the business is "functioning."
3.1 Understanding Metric Types
To measure your service accurately, you must choose the correct mathematical model for your data:
- Counter: A counter is a metric that represents a single numerical value that monotonically increases over time. A counter resets to zero when the process restarts. Counters are used to track the number of events that occur in a system. For example, the number of requests received by a server.
- Gauge: A gauge is a metric that represents a single numerical value that can arbitrarily go up and down. Gauges are typically used for measured values like temperatures or current memory usage.
- Histogram: A histogram is a metric that represents the distribution of a set of values. Histograms are used to track the distribution of values over time. For example, the response time of a web service.
- Exponential Histogram: An exponential histogram is a metric that represents the distribution of a set of values on a logarithmic scale. Exponential histograms are used to track the distribution of values that span several orders of magnitude. For example, the latency of a network request.
Part 4: Designing Intuitive Dashboards
A dashboard’s value is measured by how quickly an engineer can understand a situation during a crisis.
4.1 Hierarchy of Information
Effective dashboards follow a top-down logical flow:
- High-Level Health: The top section should answer, "Is there a problem?" using broad indicators of service availability and error frequency.
- Contextual Drill-Down: The middle section should answer, "Where is the problem?" by breaking down data by service components or geographical regions.
- Deep Diagnostics: The bottom section should provide the granular details required for root-cause analysis, such as specific system resource usage or individual trace IDs.
4.2 Visualization Principles
The goal of a visualization is to reduce the cognitive load on the observer.
- Trend Over Time: Use line charts to see patterns, shifts, or sudden spikes that indicate a change in system behavior.
- Comparative Analysis: Use bar charts or tables when comparing different services to identify outliers or underperforming nodes.
- Color as Communication: Use color intentionally. For example, consistent use of warning and error colors allows an engineer to scan a dashboard and immediately identify "hot spots" without reading the text.
- Explicit Labeling: A chart without clearly defined units or axes is open to misinterpretation. Always ensure the scale and the measurement units are explicitly defined.
Part 5: Real-World Resilience & FinOps
Observability tools should provide clarity, not overhead. Below are two scenarios for optimizing SigNoz.
5.1 Scenario A: Preventing "Observability Deadlock"
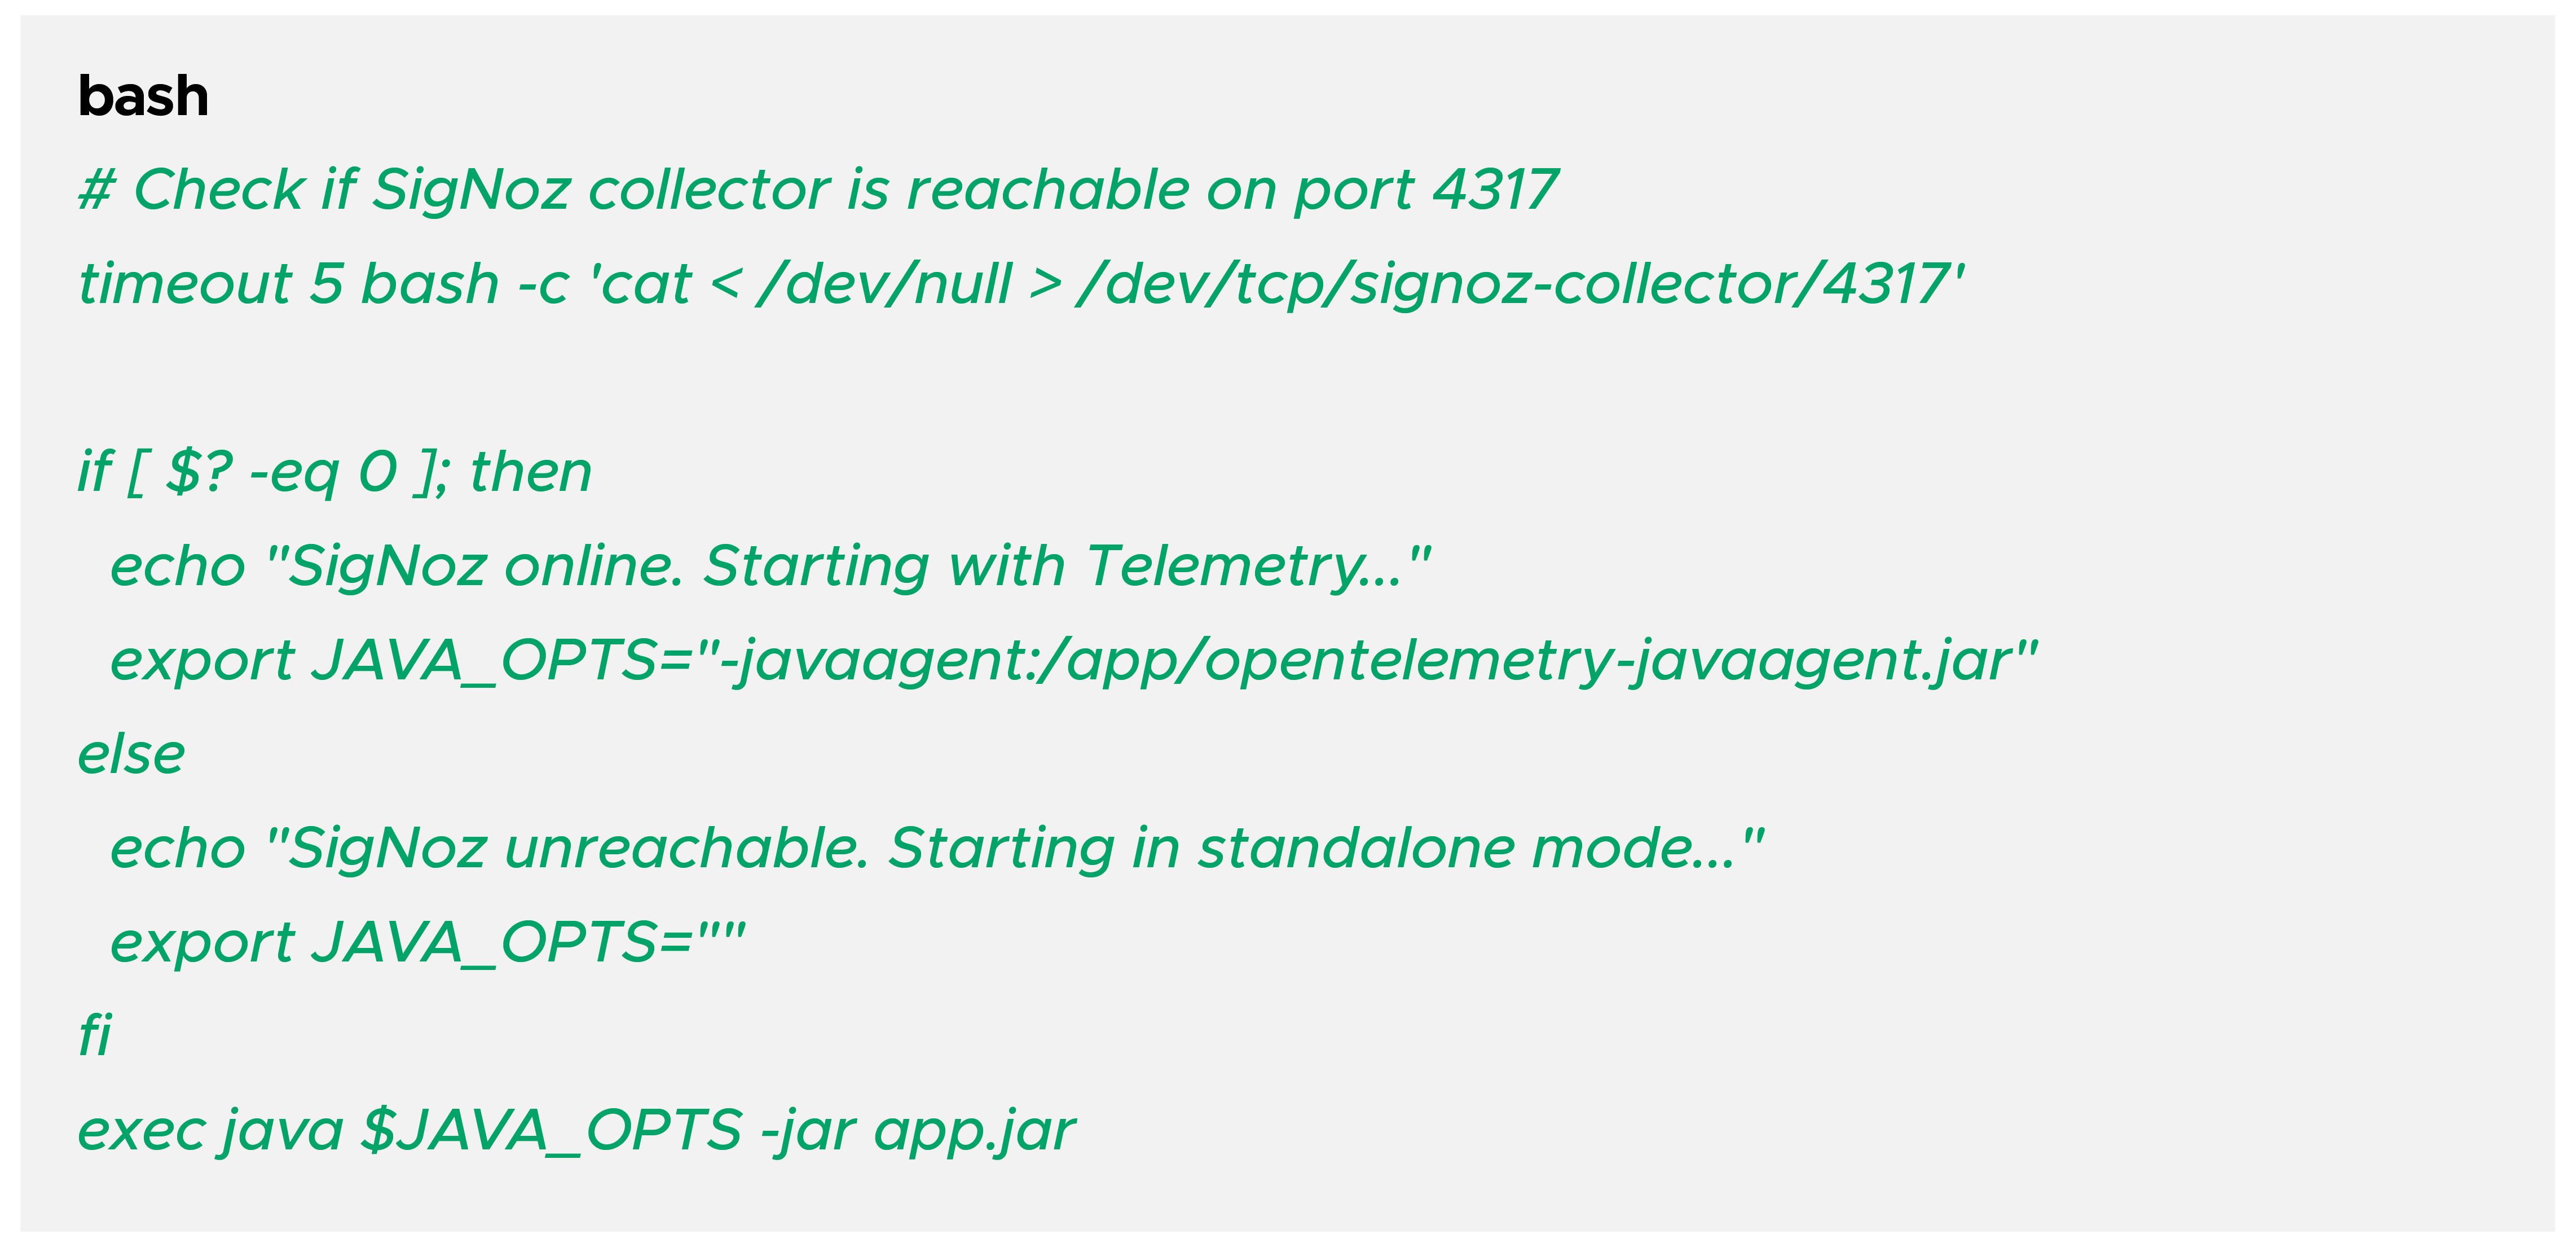
If your application process is tightly coupled with the SigNoz agent, a failure in the collector could prevent your app from booting.
The Solution: Non-Blocking Startup
Implement a wrapper script (start.sh) that checks for the collector's availability before attaching the OTel agent:
5.2 Scenario B: Cost Management via Custom Metrics
We used SigNoz to detect an AWS API cost spike caused by an aggressive polling tool. By instrumenting the specific API client, we created a "Cost Guardrail" dashboard.
Step-by-Step Slack Integration:
- Setup: Navigate to Settings -> Notification Channels.
- Add Slack: Enter your Webhook URL.
- Create Alert: Set a threshold on your custom aws_api_calls_total metric.
- Result: The team receives a Slack notification the moment a "tuner tool" exceeds 1,000 calls per minute, preventing a surprise bill.
Conclusion & Best Practices
Sample Intentionally: In high-traffic production environments, use probabilistic sampling to save on storage.
Monitor the Monitor: Set up external alerts for your SigNoz ClickHouse disk usage. If ClickHouse hits 90% disk, it will go into read-only mode.
Config as Code: Store your SigNoz dashboard JSONs and OTel Collector .yaml files in Git.
By following this structured approach, your SigNoz setup becomes more than just a tool—it becomes a reliable pillar of your SRE strategy.