


DevOps Engineer
Priyansh Choudhary is a cloud and automation enthusiast focused on building scalable and reliable infrastructure.
 Webinar
Our team routes monitoring alerts from multiple cloud monitoring tools into six dedicated Slack channels, each fed by a different tool. Individually, the alerts are useful; in aggregate, they are hard to keep up with. By the end of a week, the channels contain hundreds of messages, and the failures worth acting on, especially recurring ones, are difficult to distinguish from the routine FIRING and RESOLVED traffic surrounding them. This is alert fatigue: the alerts fire correctly, but at that volume the signal is buried in the noise.
This post describes Nova, a serverless bot that reduces a week of monitoring noise to a single, trustworthy summary. It pairs deterministic counting for exact numbers with an optional AI layer for trends and recommended actions, and runs weekly for less than a dollar a month.
At scale, a consistent pattern emerged across our six monitoring channels fed by different cloud monitoring tools:
The issue was never detection; the cloud monitoring tools detect plenty. The issue was synthesis. At that volume, recurring problems are hard to spot, and an issue that warrants a permanent fix can repeat for weeks before the pattern becomes visible. We did not need more alert rules. We needed a periodic summary that answered one question: what broke this week, and how often?
The key shift was to stop trying to alert better in real time and instead summarize. We didn't need a smarter pager; we needed a periodic report that answered: what were the top error types this week, how many times each occurred, what was trending, and what we should actually do about it?
That reframing gave us a small set of firm design goals:
We called the result Nova.
From:
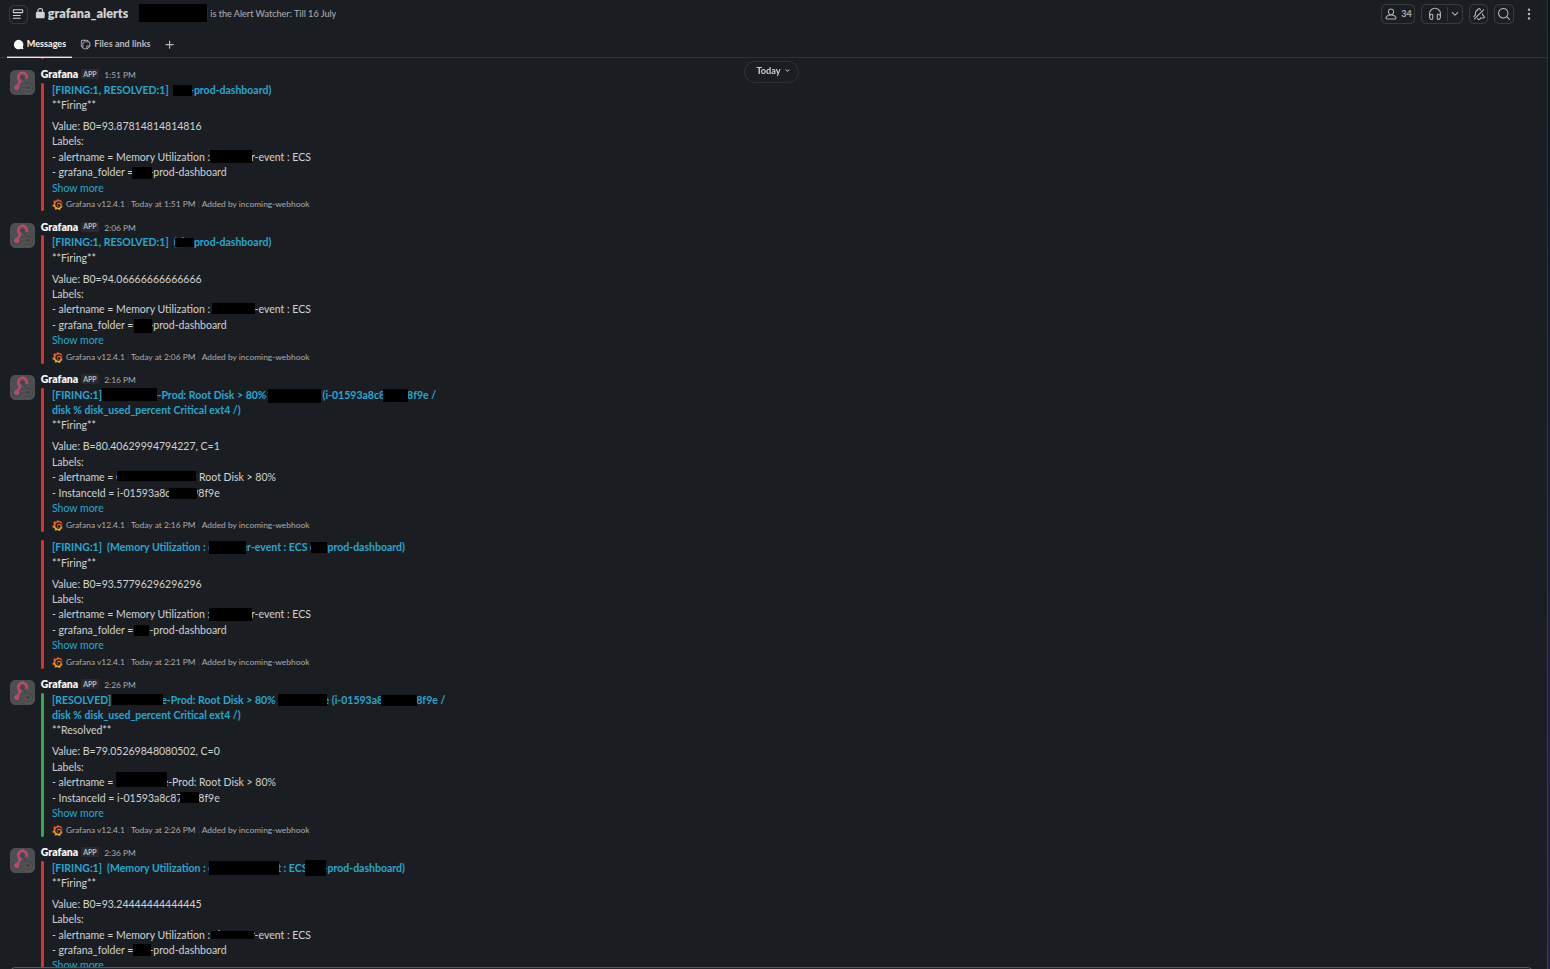 To:
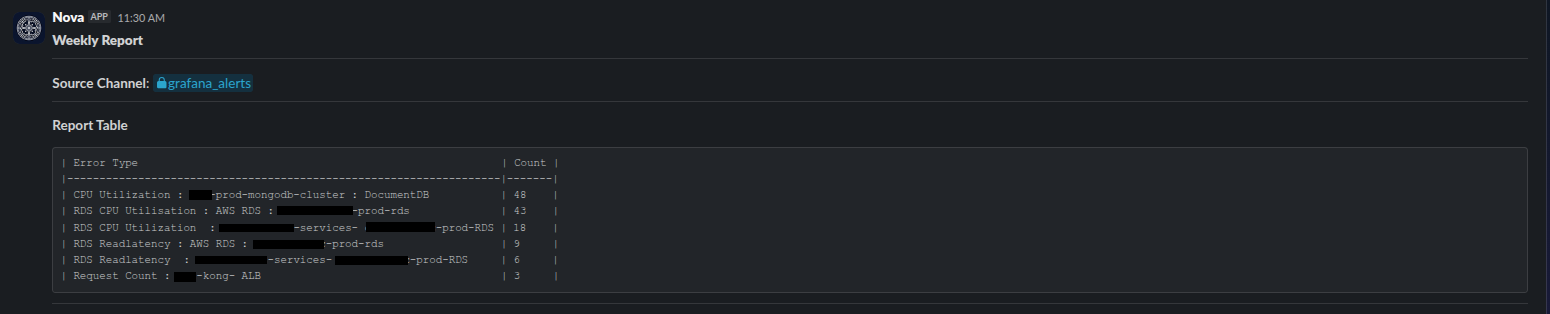
To:
 Design Principles
Feeding a week of raw logs to a language model and asking for a summary fails predictably: models approximate, and an inexact count undermines the entire report. All counting is therefore deterministic. For each channel, Nova ingests seven days of Slack history, extracts alert text from message bodies, attachments, and blocks, de-duplicates fragments, classifies each event, and tallies the results.
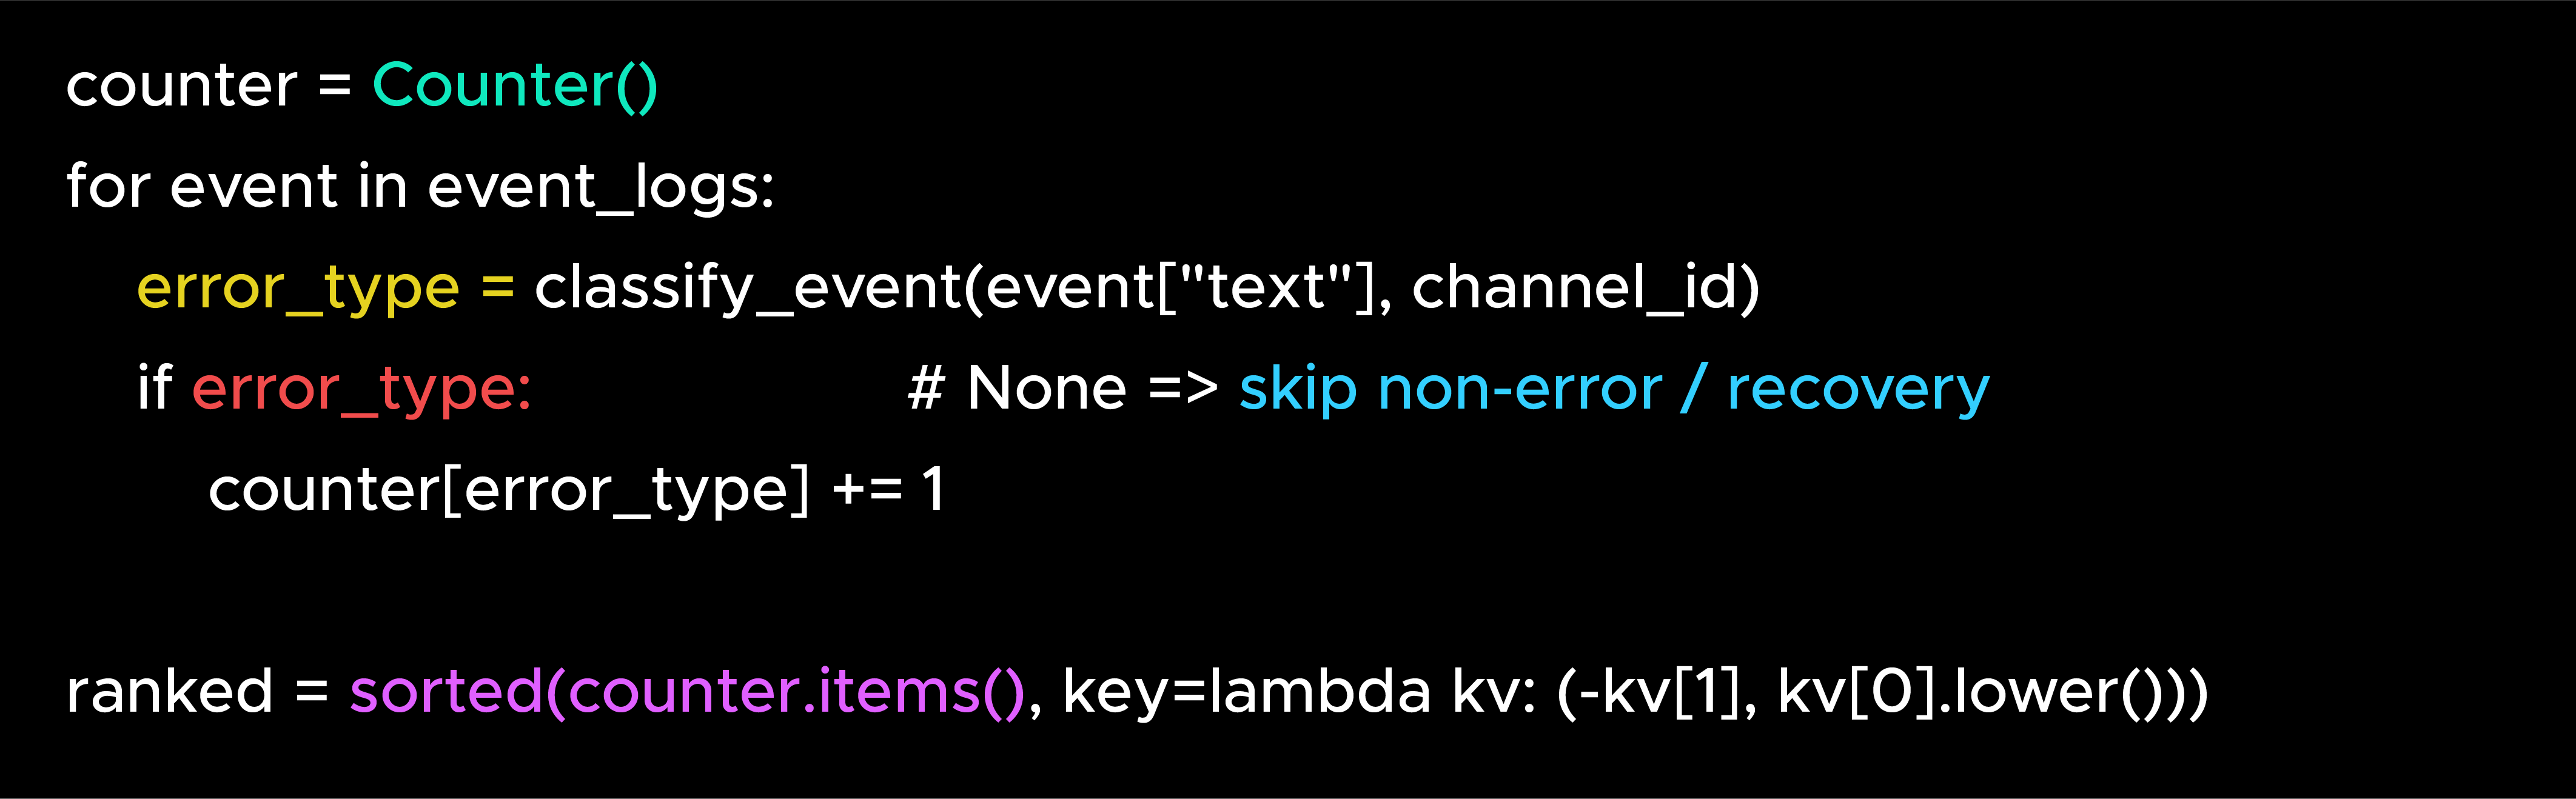 The output is a sorted Error Type | Count table that serves as ground truth for everything downstream: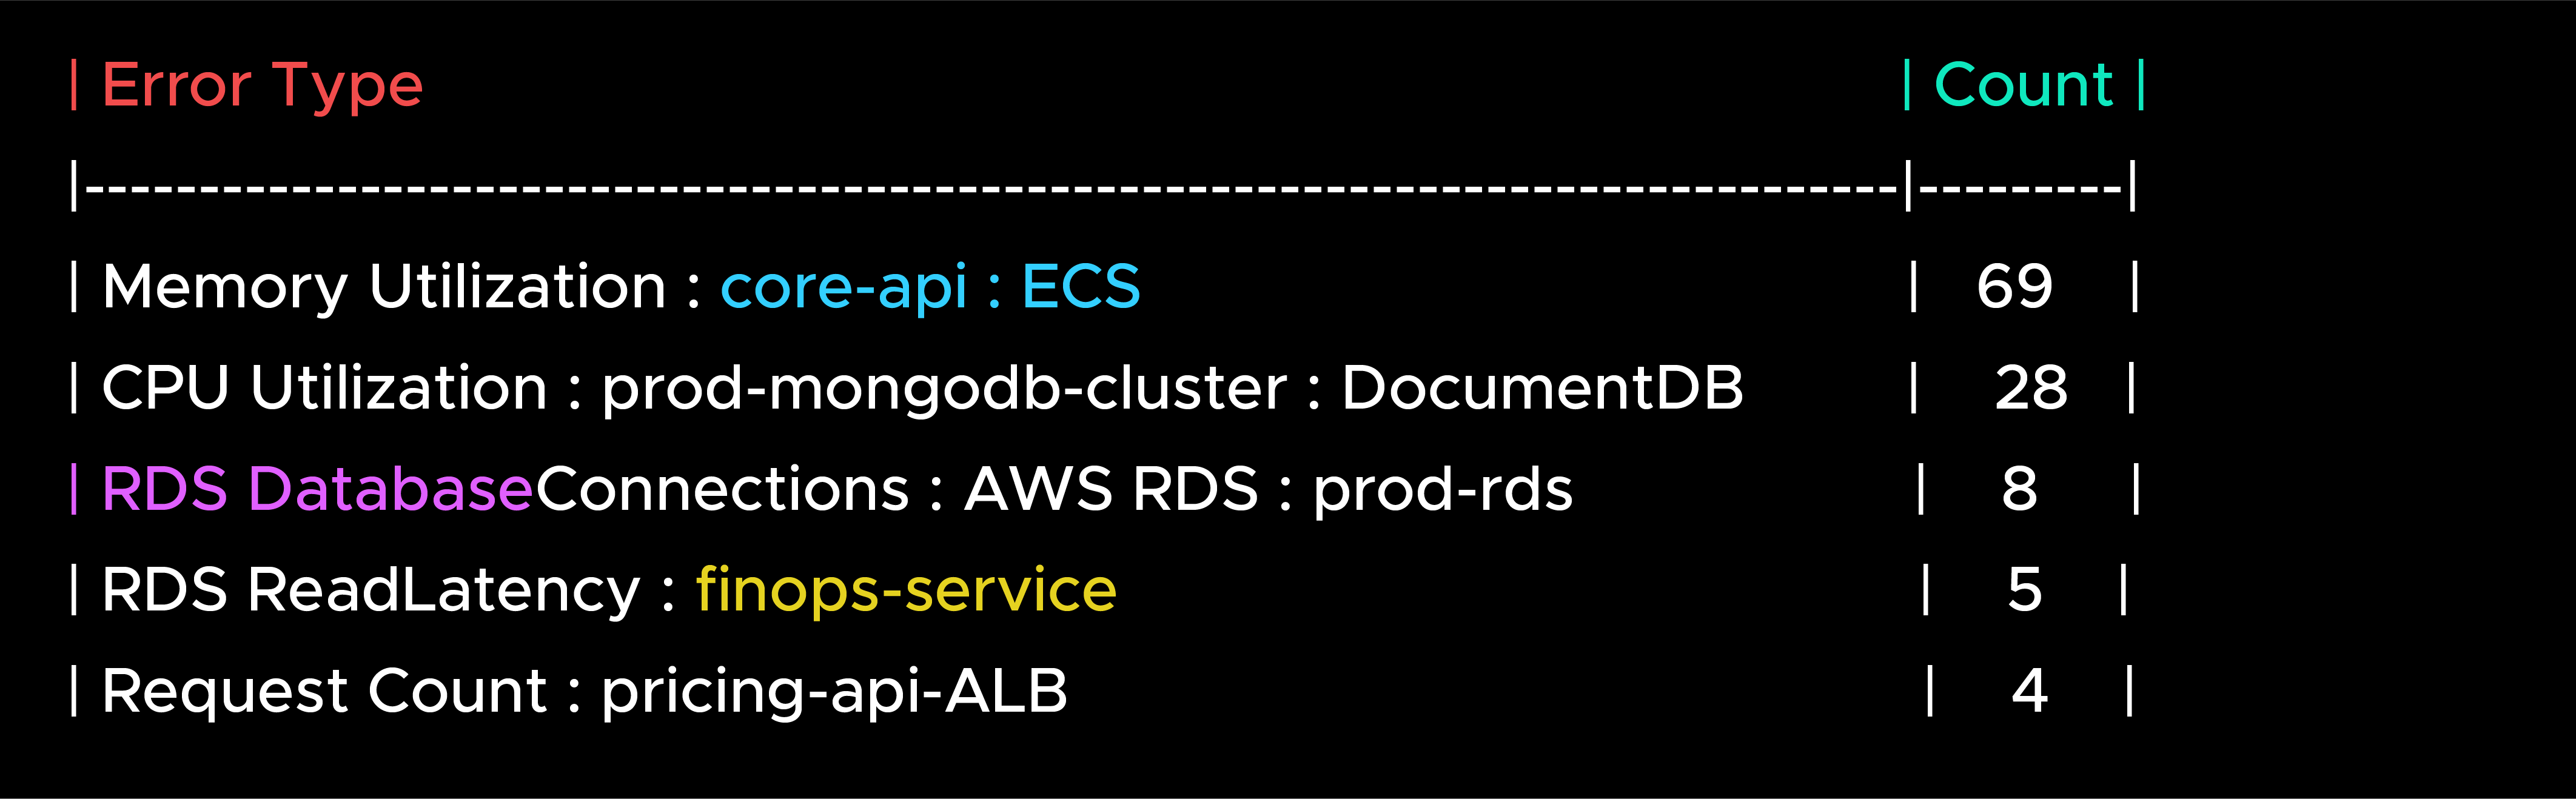
There is no universal alert format, so each source is parsed on its own terms; a single generic regex would either over-match noise or miss real errors. Many modern cloud monitoring tools generate alerts in unique formats, making normalization essential. The per-source rules stay compact:
Where a source has a well-defined shape, the parser stays tiny. The uptime prober, for example, pulls the service name from its bracketed header and pairs it with a 5xx status:
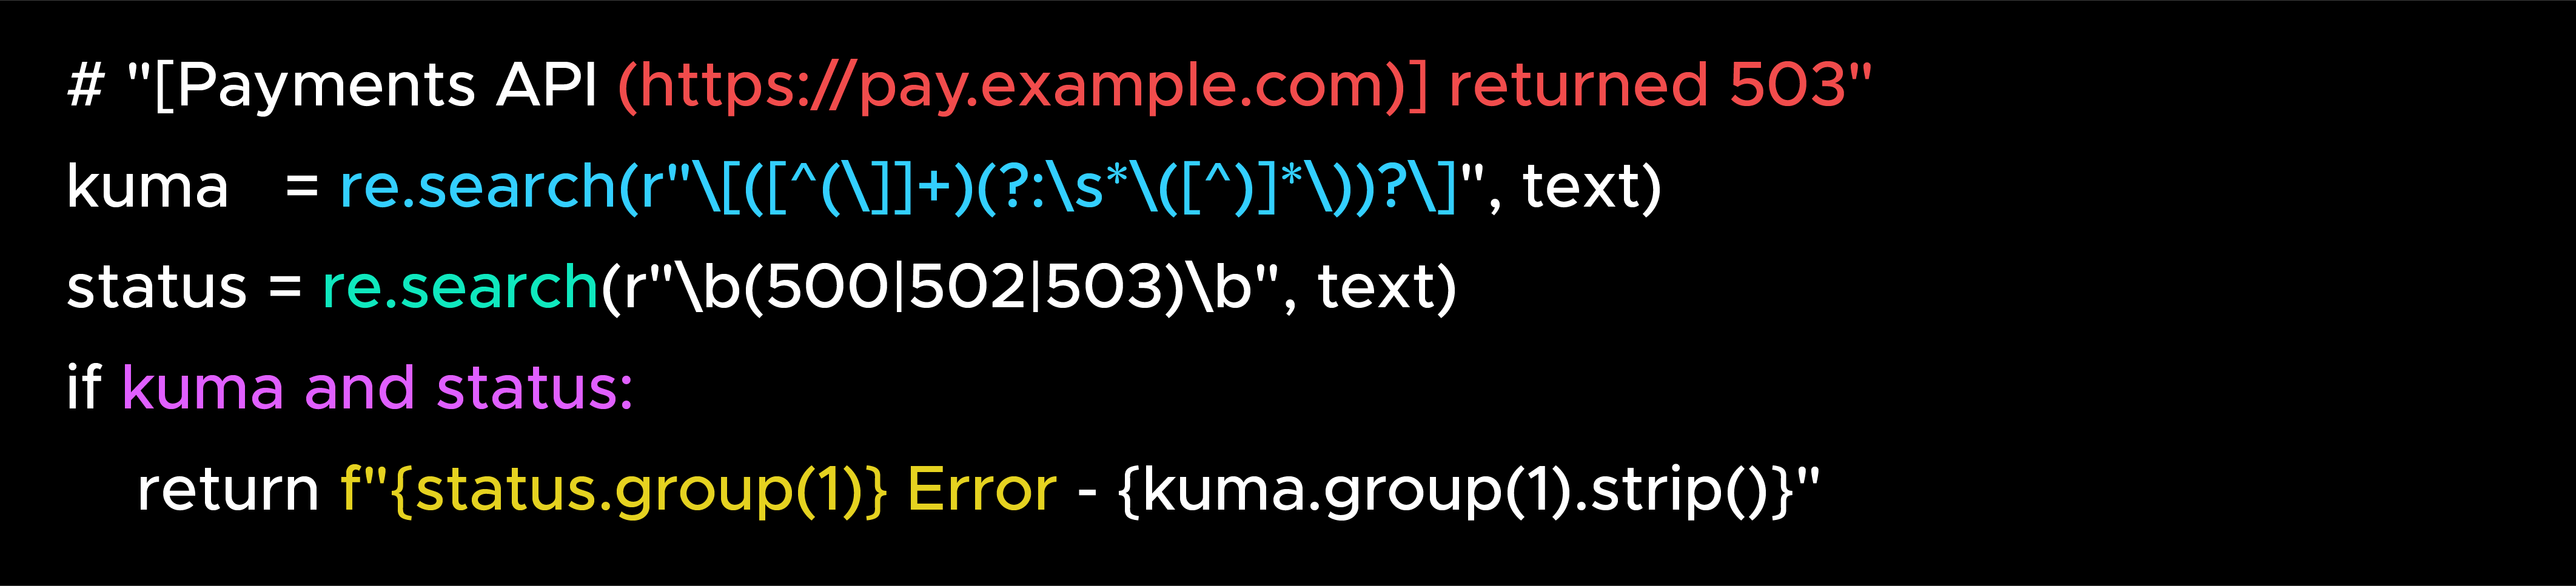 A shared success-event filter drops recoveries such as resolved, UP, and 200 OK, so the report counts problems rather than their resolutions.
Per-channel parsers feel like more code than a clever universal matcher, but they are explicit, testable, and correct, and when a new alerting tool shows up, you add one parser instead of destabilizing everything else.
The deterministic table tells you what happened and how much. It does not tell you what it means or what to do next. That is where the AI layer comes in, layered on top of the trusted counts, never underneath them.
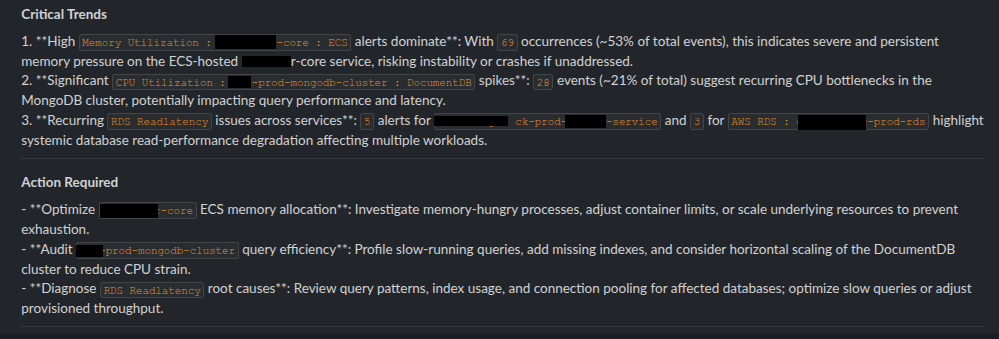
Nova uses Amazon Bedrock with Amazon Nova 2 Lite via the converse API at a temperature of 0. The critical constraint in the prompt contract is that the model is given the already-computed deterministic table and instructed to use it exactly as given, never recompute counts. Its only job is to narrate: produce at least three Critical Trends (each with a share-of-total percentage) and at least three concrete Action Items.
Because models can drift, a fact-guard post-processor reconciles the generated text with deterministic facts, removing unsupported claims such as phantom success states or duplicate status codes.
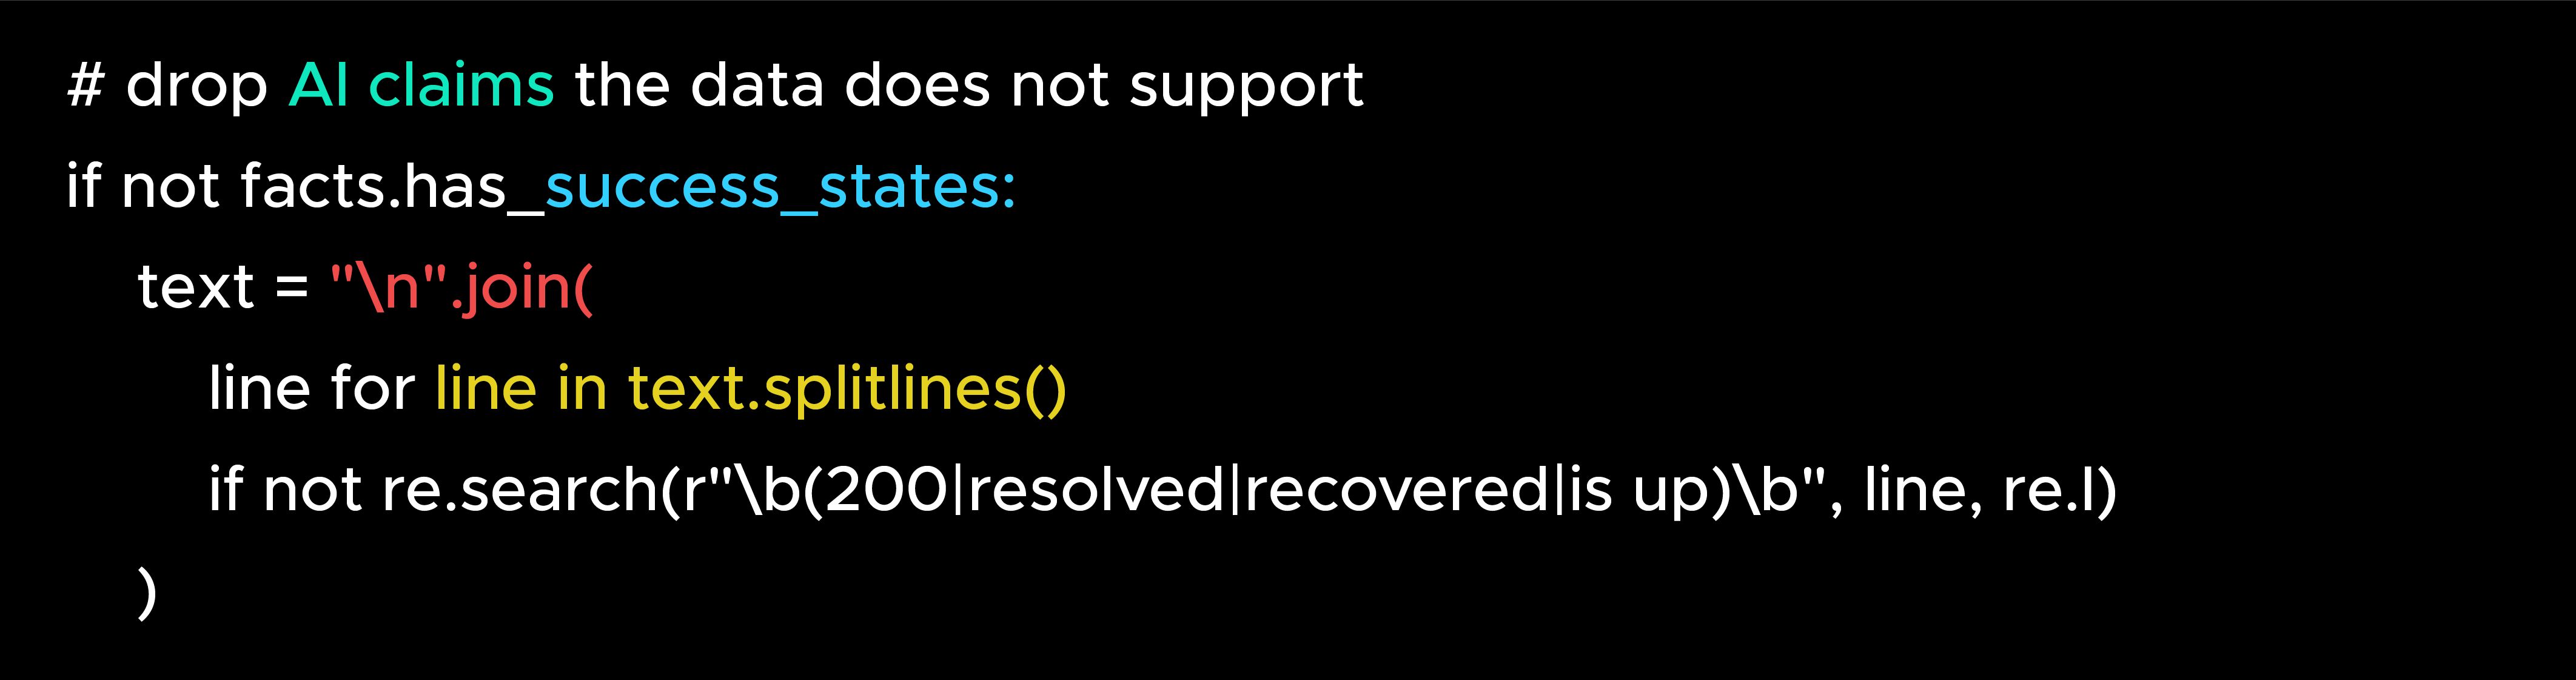 Three fallback strategies (full, lighter, compact) keep each request within token limits, and throttling is handled through exponential backoff. Because the counts are computed independently, the deterministic table remains the reliable foundation regardless of the model's output.
A representative AI section reads:
 Architecture: Serverless, Scheduled, and Fanned-Out
Every component is serverless, so nothing runs between reports:
The architecture complements existing cloud monitoring tools without requiring changes to alerting workflows.
A single invocation that tries to process all six channels in a single pass is fragile: Slack history is paginated and rate-limited, and AWS Bedrock calls add latency, so a single slow channel can push the whole run toward the Lambda timeout. Instead, the same function runs in two modes:
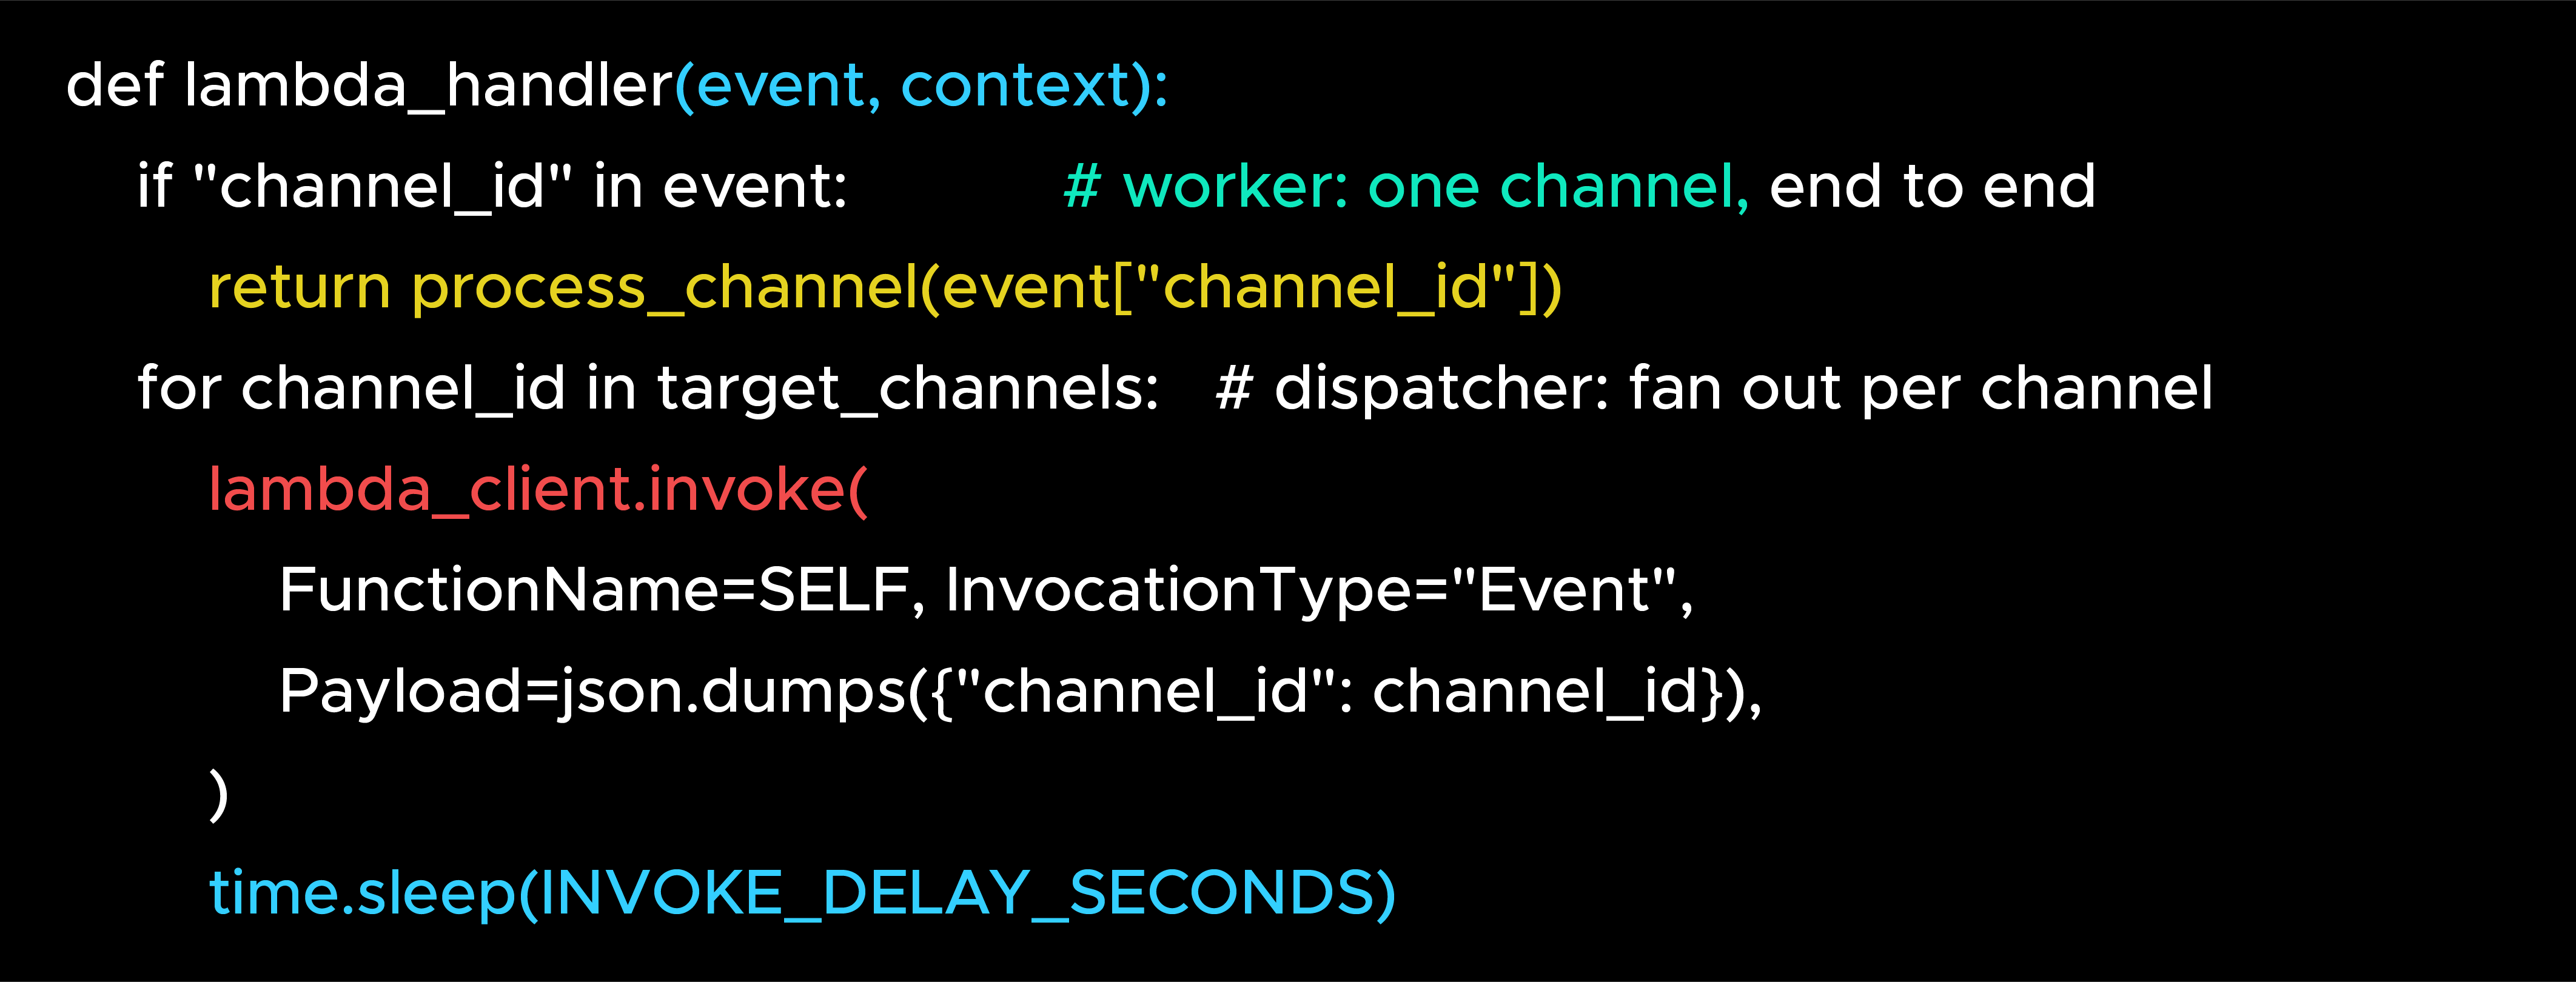 This keeps each execution small, isolates failures to a single channel, and makes the whole system trivially parallel. Together, paged Slack reads and the deliberate inter-worker delay keep Nova comfortably under Slack's rate limits, even when several channels are processed back-to-back. The configuration snapshot:
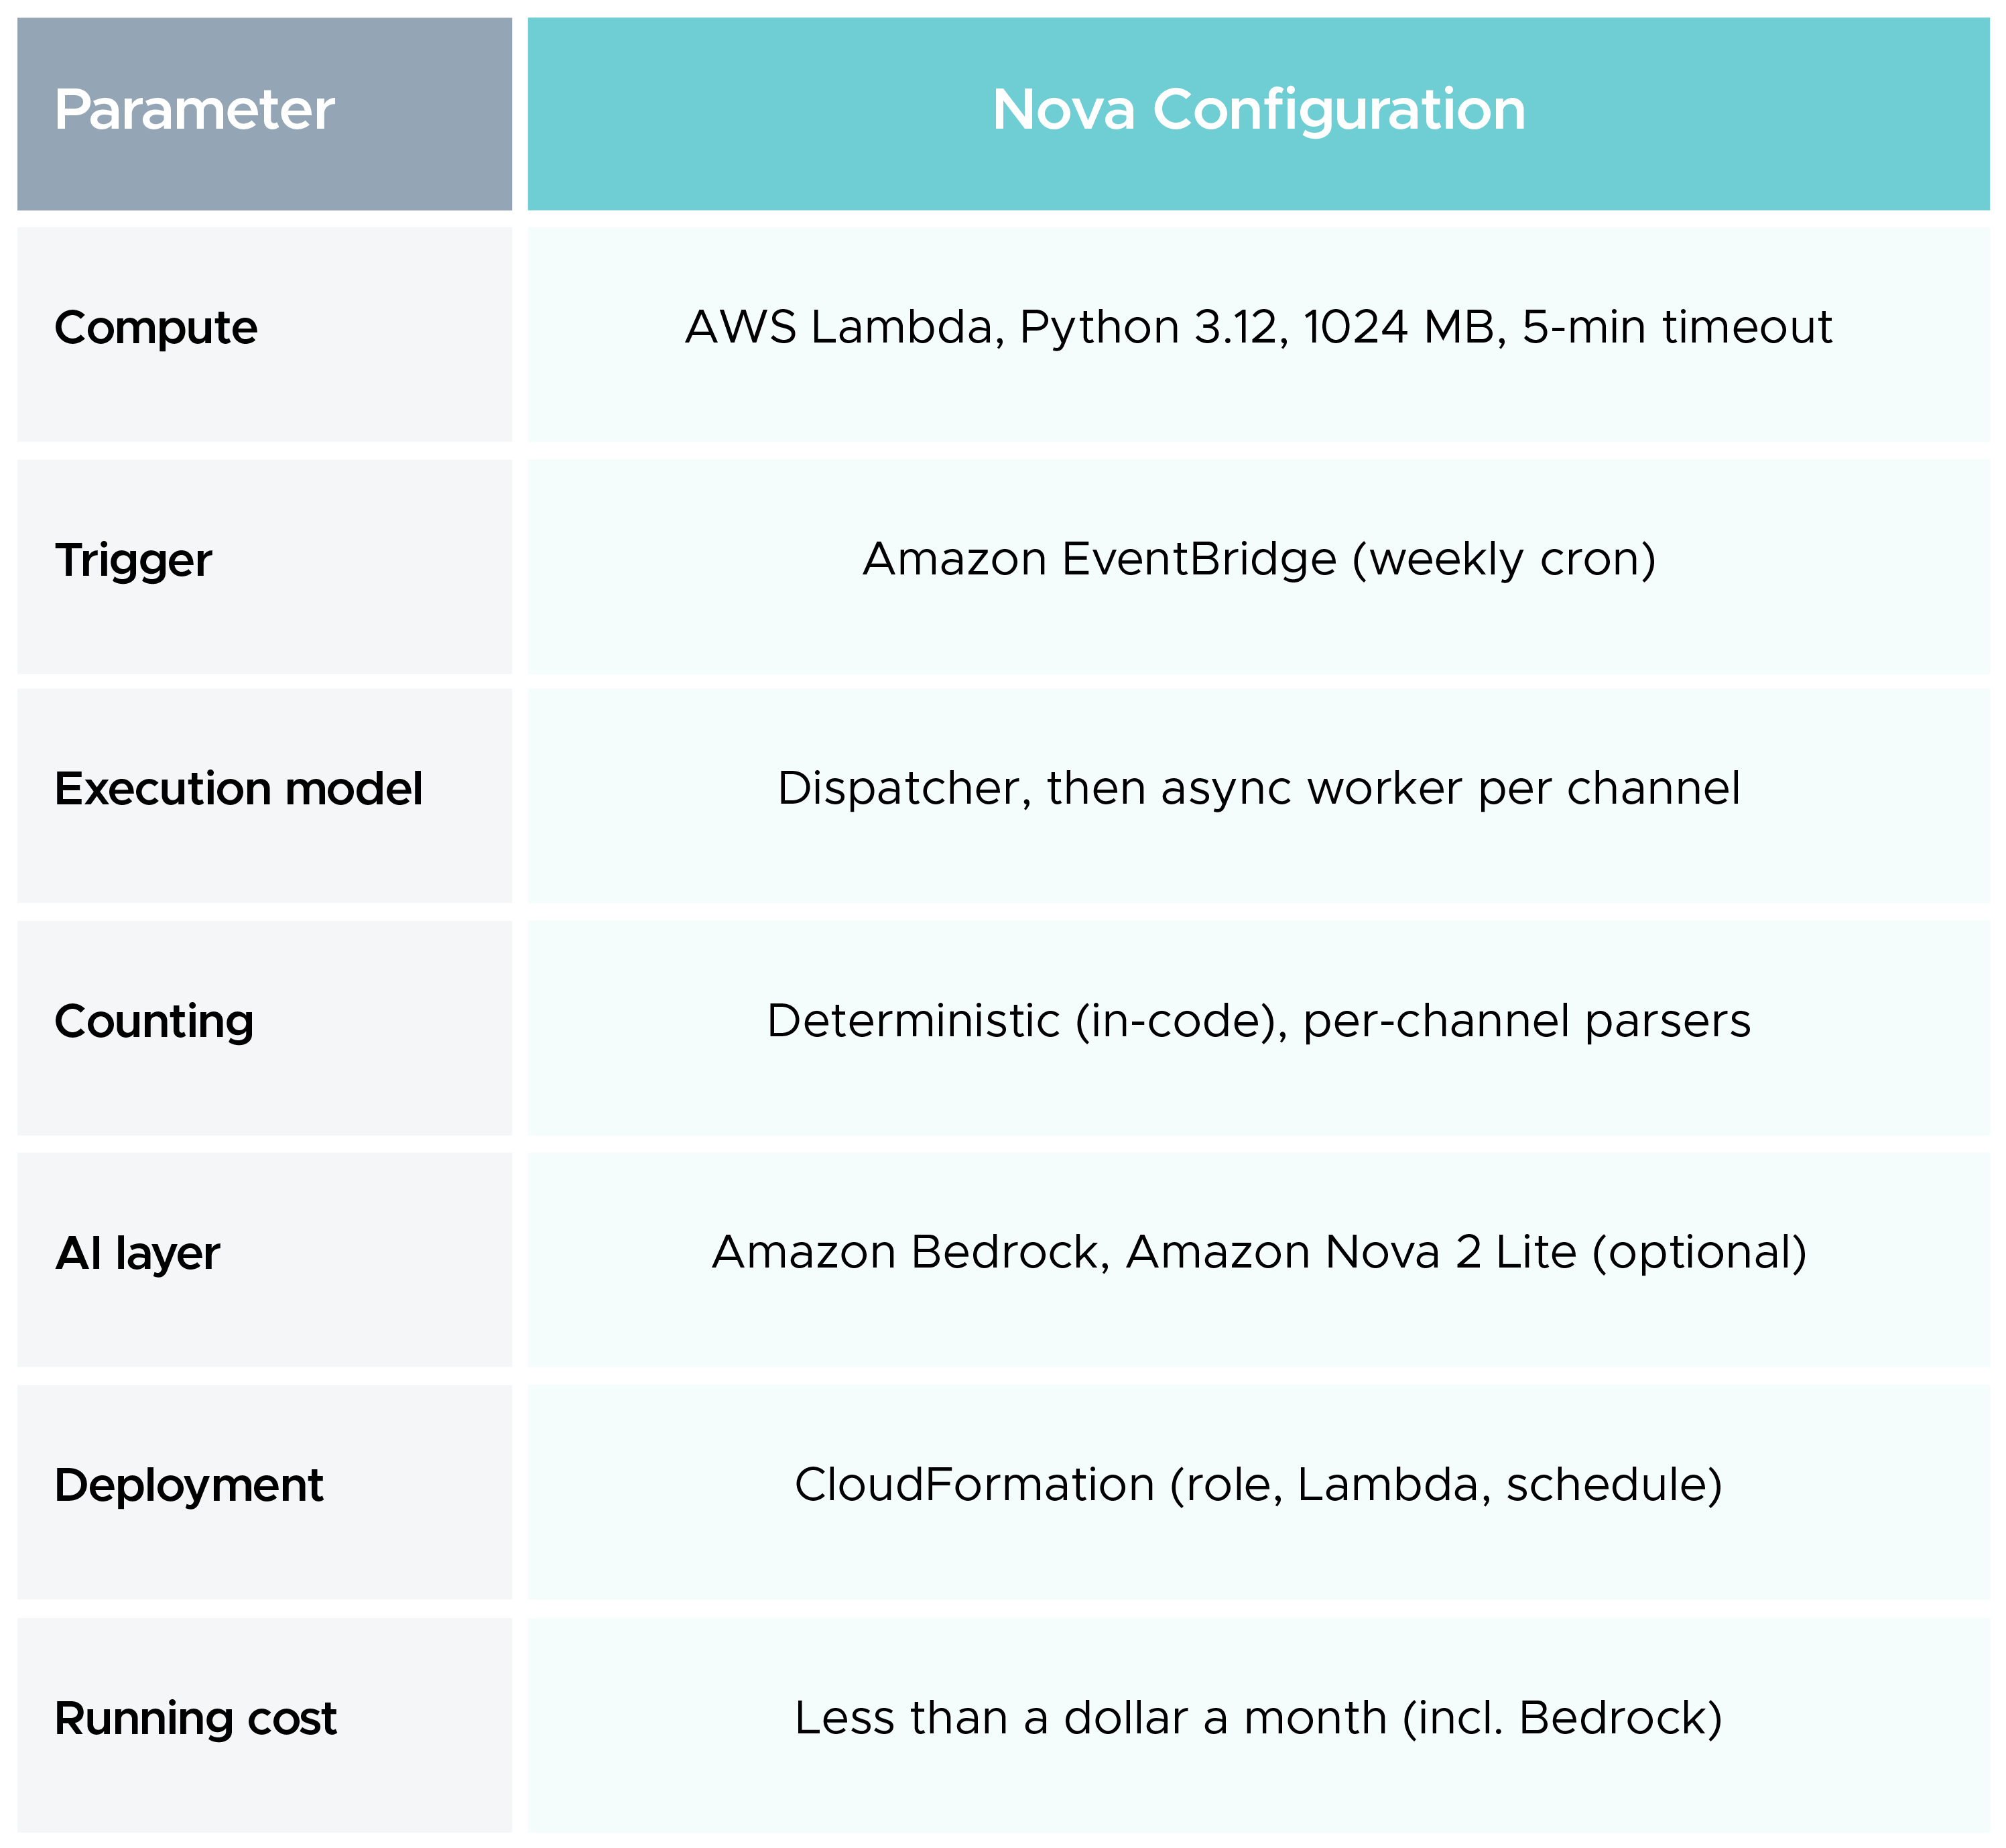 Operationally, Nova is almost free. It runs weekly on a 1024 MB, 5-minute Lambda function, finishes in seconds, and costs less than a dollar a month, including Amazon Nova 2 Lite calls on AWS Bedrock. For a system that replaces a week of manual alert-triage, that is effectively rounding error.
In a typical week, Nova collapses hundreds of raw alerts from cloud monitoring tools across six channels into a handful of ranked error types.
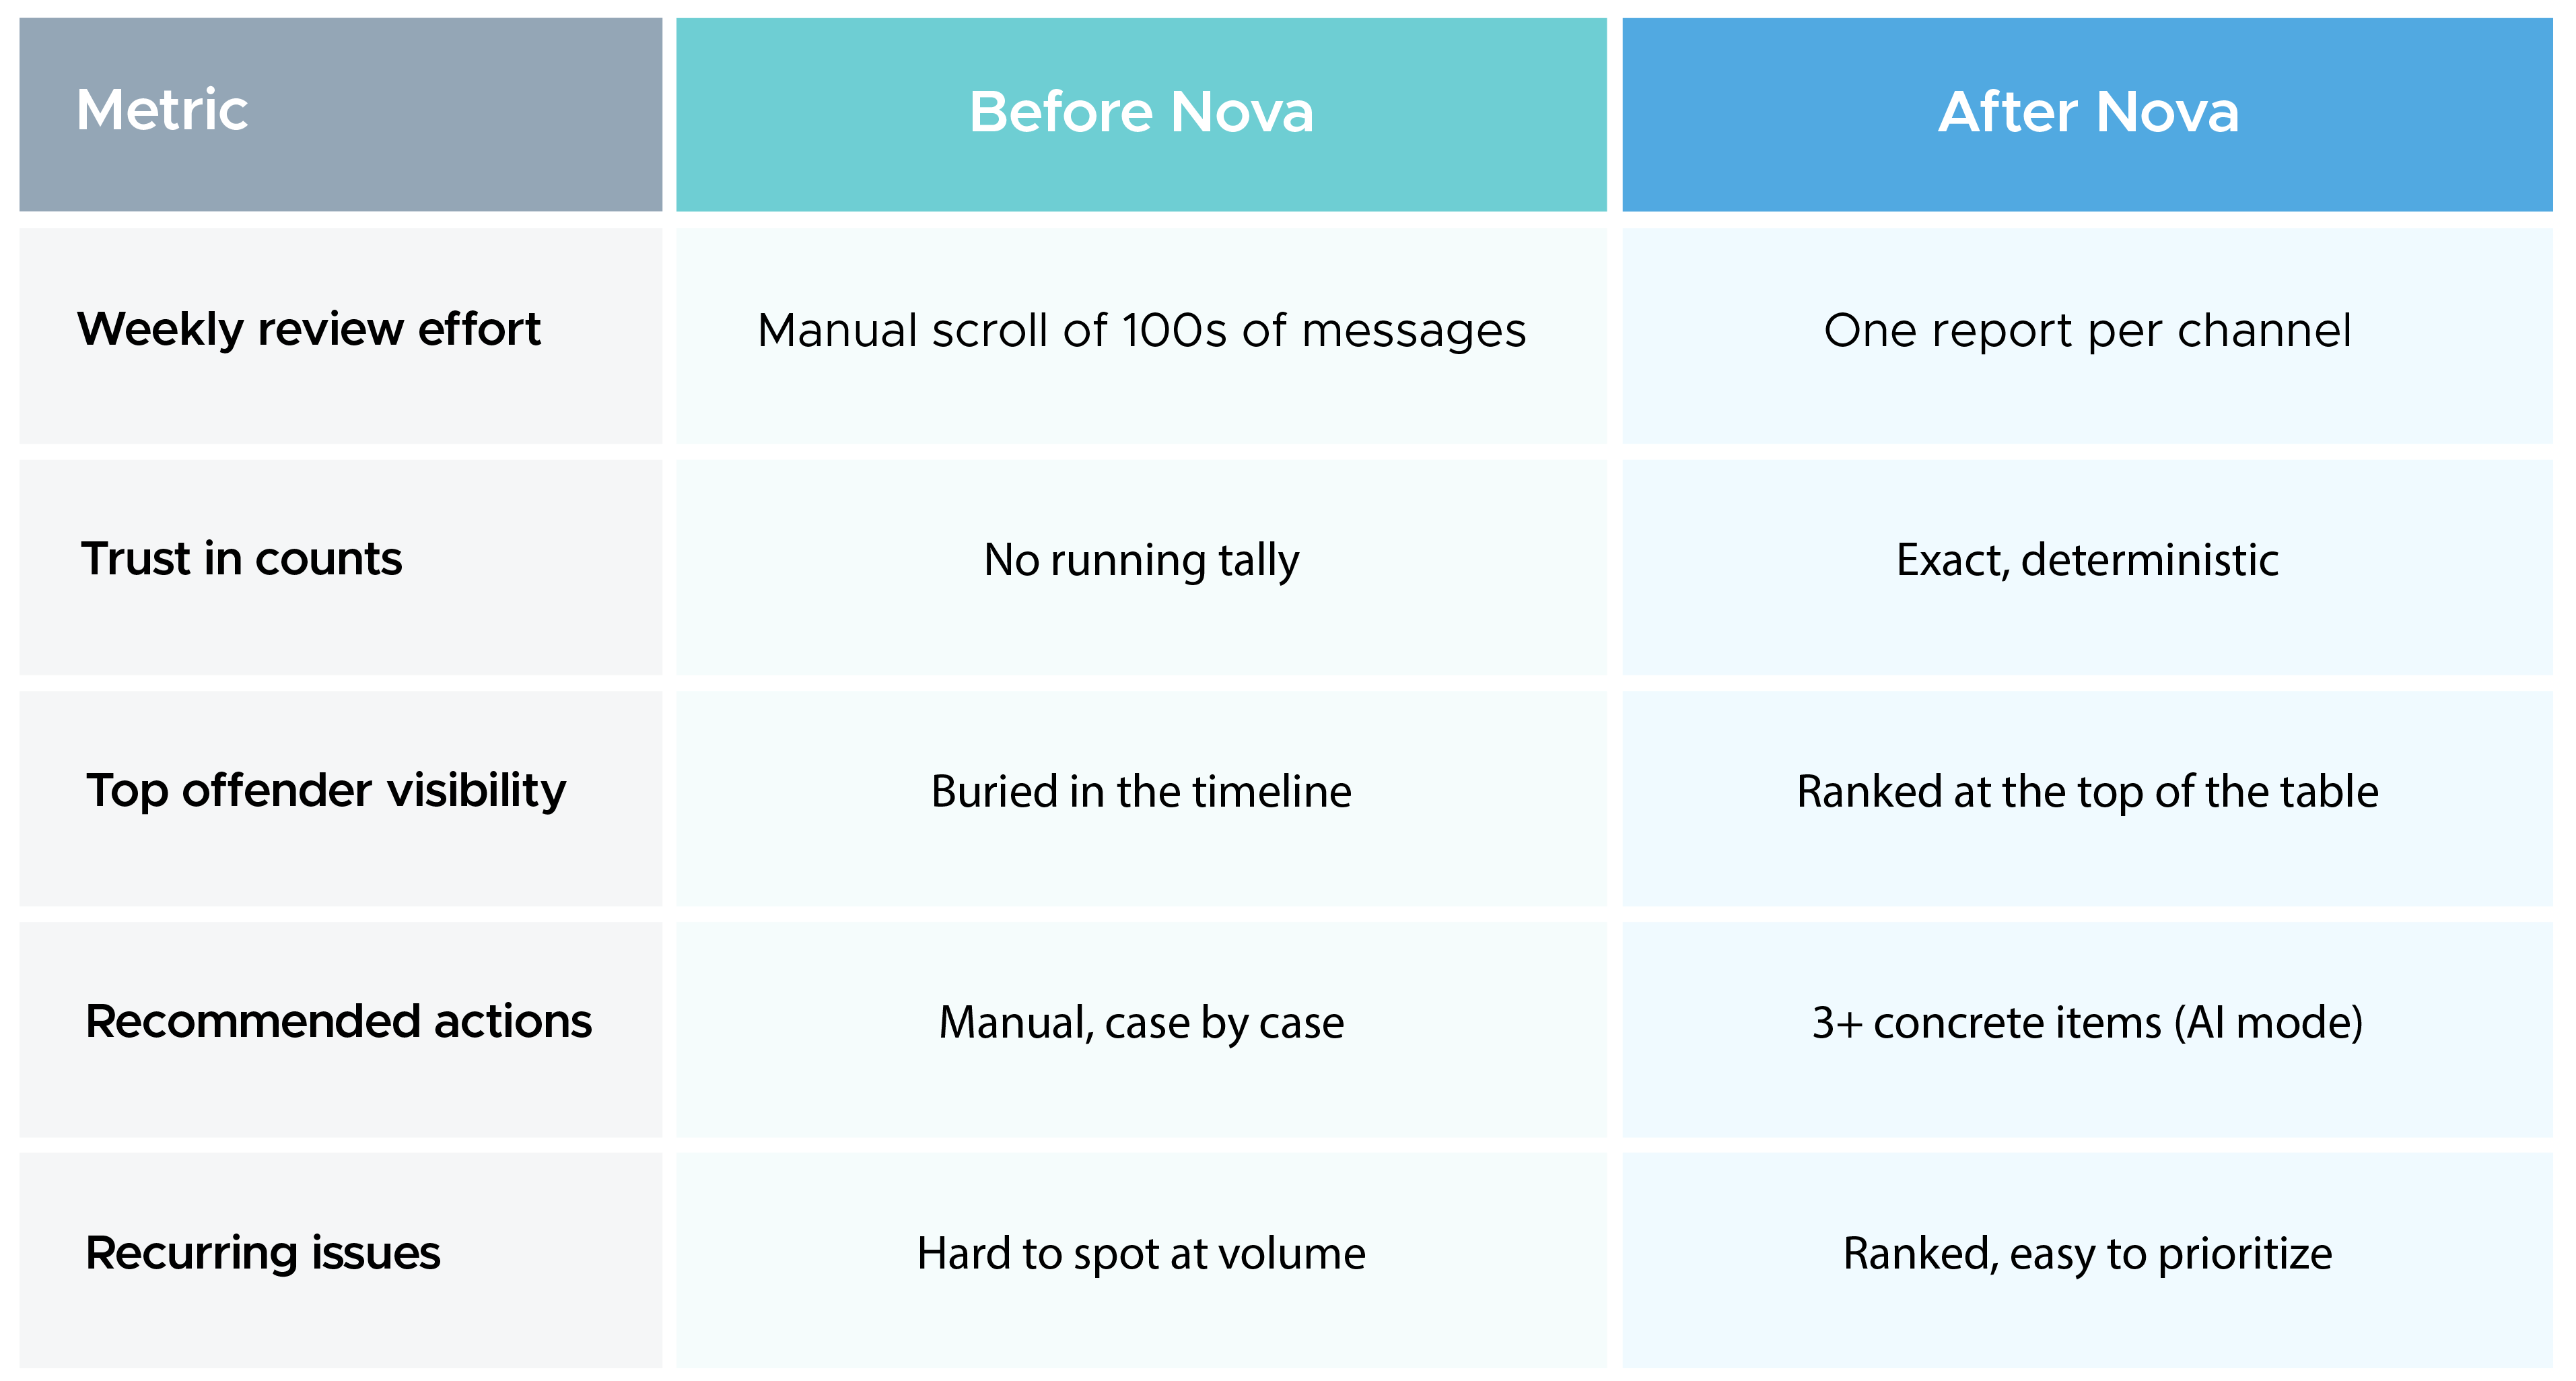
The behavioral change was immediate. A week that previously produced hundreds of raw FIRING/RESOLVED messages spread across six channels now produces one Weekly Report per channel: a clean counts table and, in AI mode, three trends and three actions beneath it.
The value showed up in the very first reports. In one week's dashboard channel, Nova surfaced memory pressure on a single AWS ECS service as 69 events, roughly 53% of all noise in that channel: the biggest signal in the workspace, and one that was easy to lose in the manual scroll. Because the report ranks issues by how often they recur, the patterns worth fixing rise to the top, allowing the team to prioritize and resolve repeat offenders rather than handling them one alert at a time.
 Lessons Learned
Anything numeric belongs in deterministic aggregation; the model's job is only to explain what the numbers mean. Drawing that boundary sharply is what makes an AI-assisted report trustworthy instead of plausible-but-wrong.
Prompt instructions are necessary but not sufficient. Validate the model's output against the ground truth after generation, and strip any claims the data doesn't support. Give the facts veto power over the prose.
Parse per source. Explicit, boring parsers keyed by channel are far more maintainable and correct than one clever regex that tries to understand every tool at once.
Alert fatigue is a synthesis problem, not a detection problem. A weekly digest that surfaces recurring issues, ones that are otherwise hard to catch at volume, does more for reliability than any threshold tweak, because the goal of monitoring is to inform, not merely to notify.
Teams using multiple cloud monitoring tools often benefit more from alert summarization than from adding additional notification rules.
We didn't add a single new alert. We added a weekly summary that turns a week of boring, noisy notifications into a short, trustworthy, and actionable report: deterministic where it counts, intelligent where it helps, and serverless so it runs itself.
The broader takeaway is simple:
When the noise floor rises, the highest-leverage move usually isn't another alert rule; it's to summarize what you already have, and to be rigorous about which parts of that summary you allow a model to touch. Keep the counting honest, let the AI do the reasoning on top, and an overwhelming stream of alerts becomes a short weekly report the team can actually act on, including recurring issues.
99% of companies saved up to 15% monthly with this plan & achieved peak performance.