


DevOps Engineer
Prerana is a tech enthusiast with a passion for building scalable and reliable cloud systems.


Find your cloud savings in under 5 minutes

Get a $100 reward on signup


At CloudKeeper, our team ships a wide range of services — backend APIs, front-end apps, Kong API gateways, Fluent Bit and Fluentd stacks — through a single shared Jenkins library. Every run posts its outcome to a Slack channel: green for success, red for failure, yellow for aborted. It works, and the team relies on it.
But over time we noticed something. The red messages told us a build had failed. They never told us why. And answering that question — every single time — quietly consumed more engineering hours than the fixes themselves.
So we built a small AI layer into our failure notifications. Now, when a build fails, the Slack alert arrives with the likely root cause already written into it. This is the story of why and how.
Jenkins is very good at detection. The moment a pipeline breaks, it stops, marks the build red, and fires a notification. That part was never broken.
The problem was everything that happened after the notification. A failure message looked like this:

Functional, but inert. It's a link, not an answer. To learn anything, an engineer had to leave Slack, open Jenkins, and start reading. Four things made that costly:
The bottleneck, in other words, was never detection. It was diagnosis. That is the part we set out to automate.
The instinct with a noisy failure channel is to add more — more log lines in the message, more links, more dashboards. But dumping fifty log lines into Slack just moves the haystack from Jenkins to Slack. It doesn't answer the question.
We reframed the goal. The alert shouldn't carry more information; it should carry the right information—a short, plain-language statement of what broke and why, in the same message that already told you the build failed.
That reframing set our constraints. To be useful, the system had to read unstructured logs the way an experienced engineer would, focus on the real error and skip the noise, remember what it had already seen so recurring failures were free and instant, never leak a secret to an external model, and — above all — never break the notification it was trying to improve.
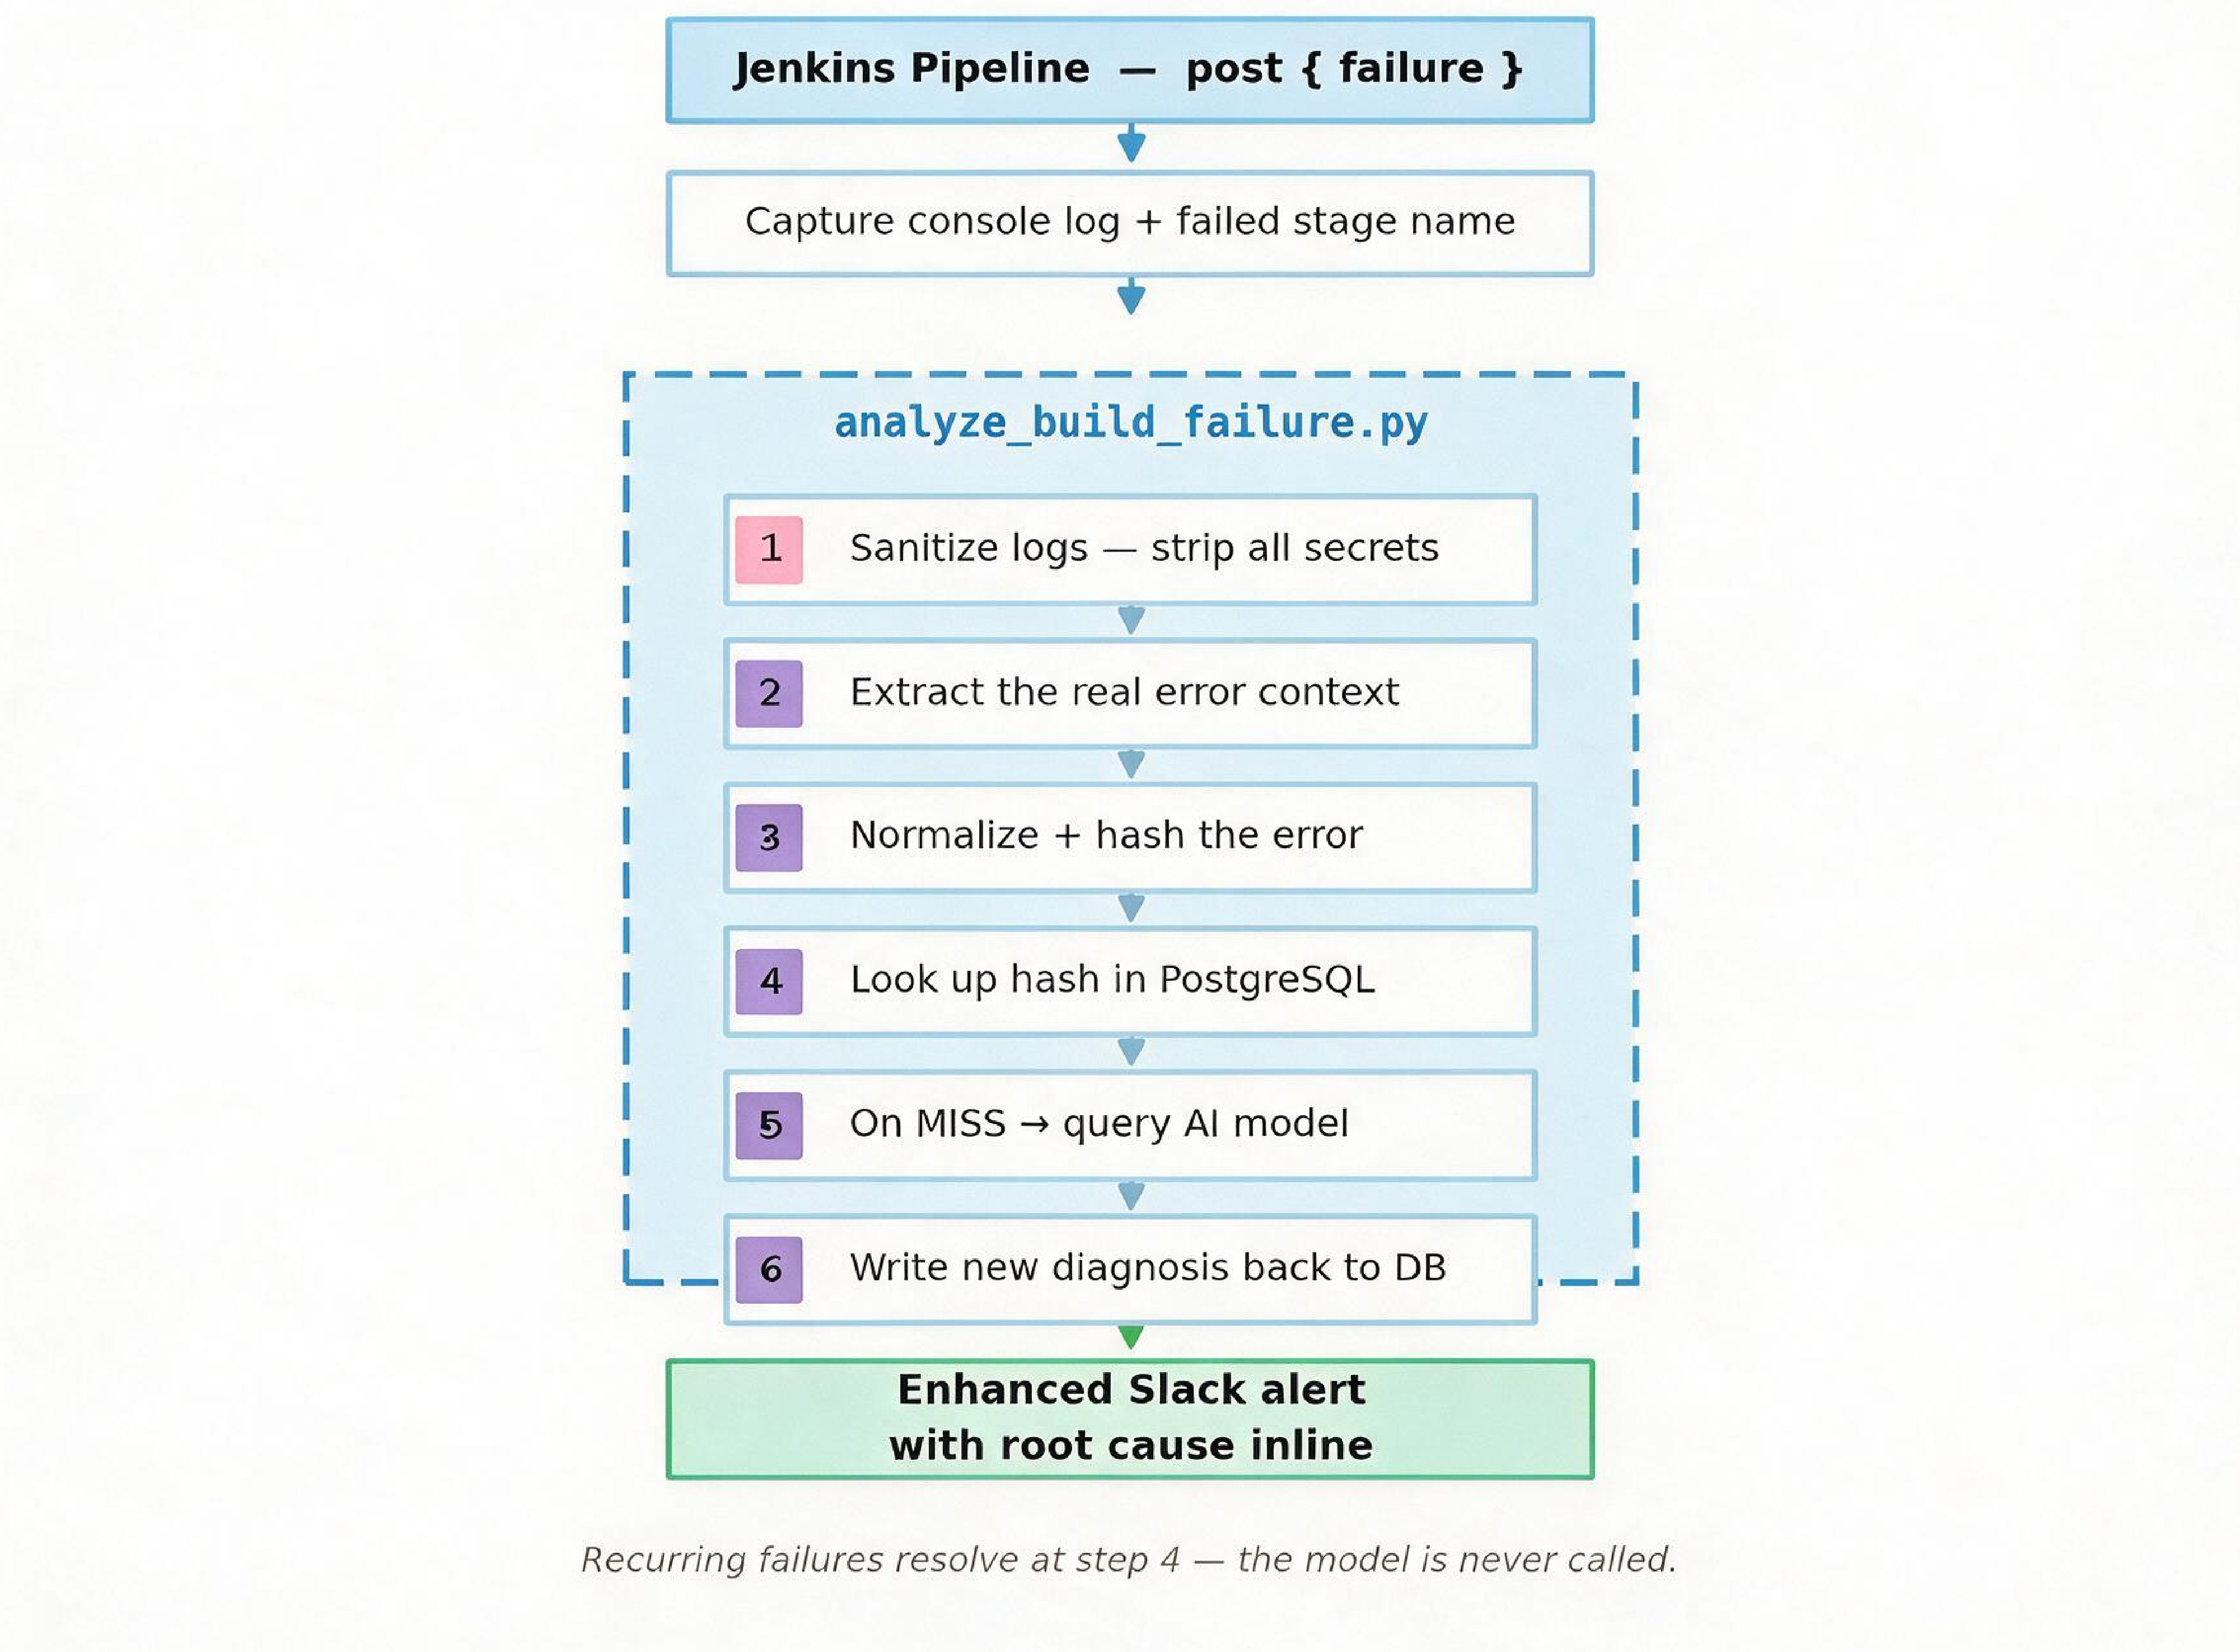
Four principles shaped the build — and they map directly onto the order the analyzer actually runs each failure through.
The analyzer first scrubs the log. Console output is full of credentials, so before a single byte leaves our environment, it redacts passwords, tokens, API keys, AWS access and secret keys, Bearer and Basic headers, database connection strings, and PEM private-key blocks. We get the benefit of a powerful external model without ever handing it a secret.
Next, rather than passing the whole log along, the analyzer isolates the section that actually matters and strips the lines that reliably mislead. Less noise in means a sharper diagnosis out.
Only then does it consider the model — and even here, the model is the last resort, not the first. The extracted error is normalized, hashed, and looked up in a database of previously diagnosed failures. If it's been seen before, the answer comes straight from the cache. Only a genuinely new error reaches the model. Diagnose each problem once; serve every recurrence from memory.
Wrapping all of the above: the enhancement must never become a new single point of failure. If the model is unreachable, the database is down, or a dependency is missing, the system falls back to the standard failure notification. The enhancement is optional; the alert is not.
When an error is genuinely new, the analyzer sends its sanitized, focused context to a hosted large language model with a tightly scoped prompt. The model is told to act as an expert DevOps service provider and to return a 2–3 sentence root cause that fits cleanly in a Slack message, highlighting the specific dependency, error code, or class involved in backticks and skipping filler.
The design choice here mirrors our first principle: let code count, let AI narrate. We don't ask the model to decide which log lines are errors, remember anything, or count occurrences. Deterministic code handles extraction and caching. The model does only what it's uniquely good at — reading messy human text and explaining it in plain language.
A representative result:
The build failed due to missing dependencies and failed downloads. The com.example:app-dtos:x.y.z and com.example:app-core:x.y.z dependencies aren't downloading correctly, resulting in a 403 Forbidden error. The build is also unable to find symbol for classes like SomeResponseDTO.
Three sentences. A stage lead can read that in Slack and know, without opening Jenkins, that this is a repository-access problem, not a code bug.
The whole system is deliberately small. No new service to operate — it lives inside the Jenkins shared library every pipeline already imports, backed by one PostgreSQL table and one API call.
Our library tracks the failing stage by recording env.STAGE_NAME into a FAILED_STAGE variable in each stage's error handler. When the pipeline reaches its failure post-block, it calls the analyzer with the channel, the failed stage, and credentials pulled from the Jenkins credential store — never hard-coded:
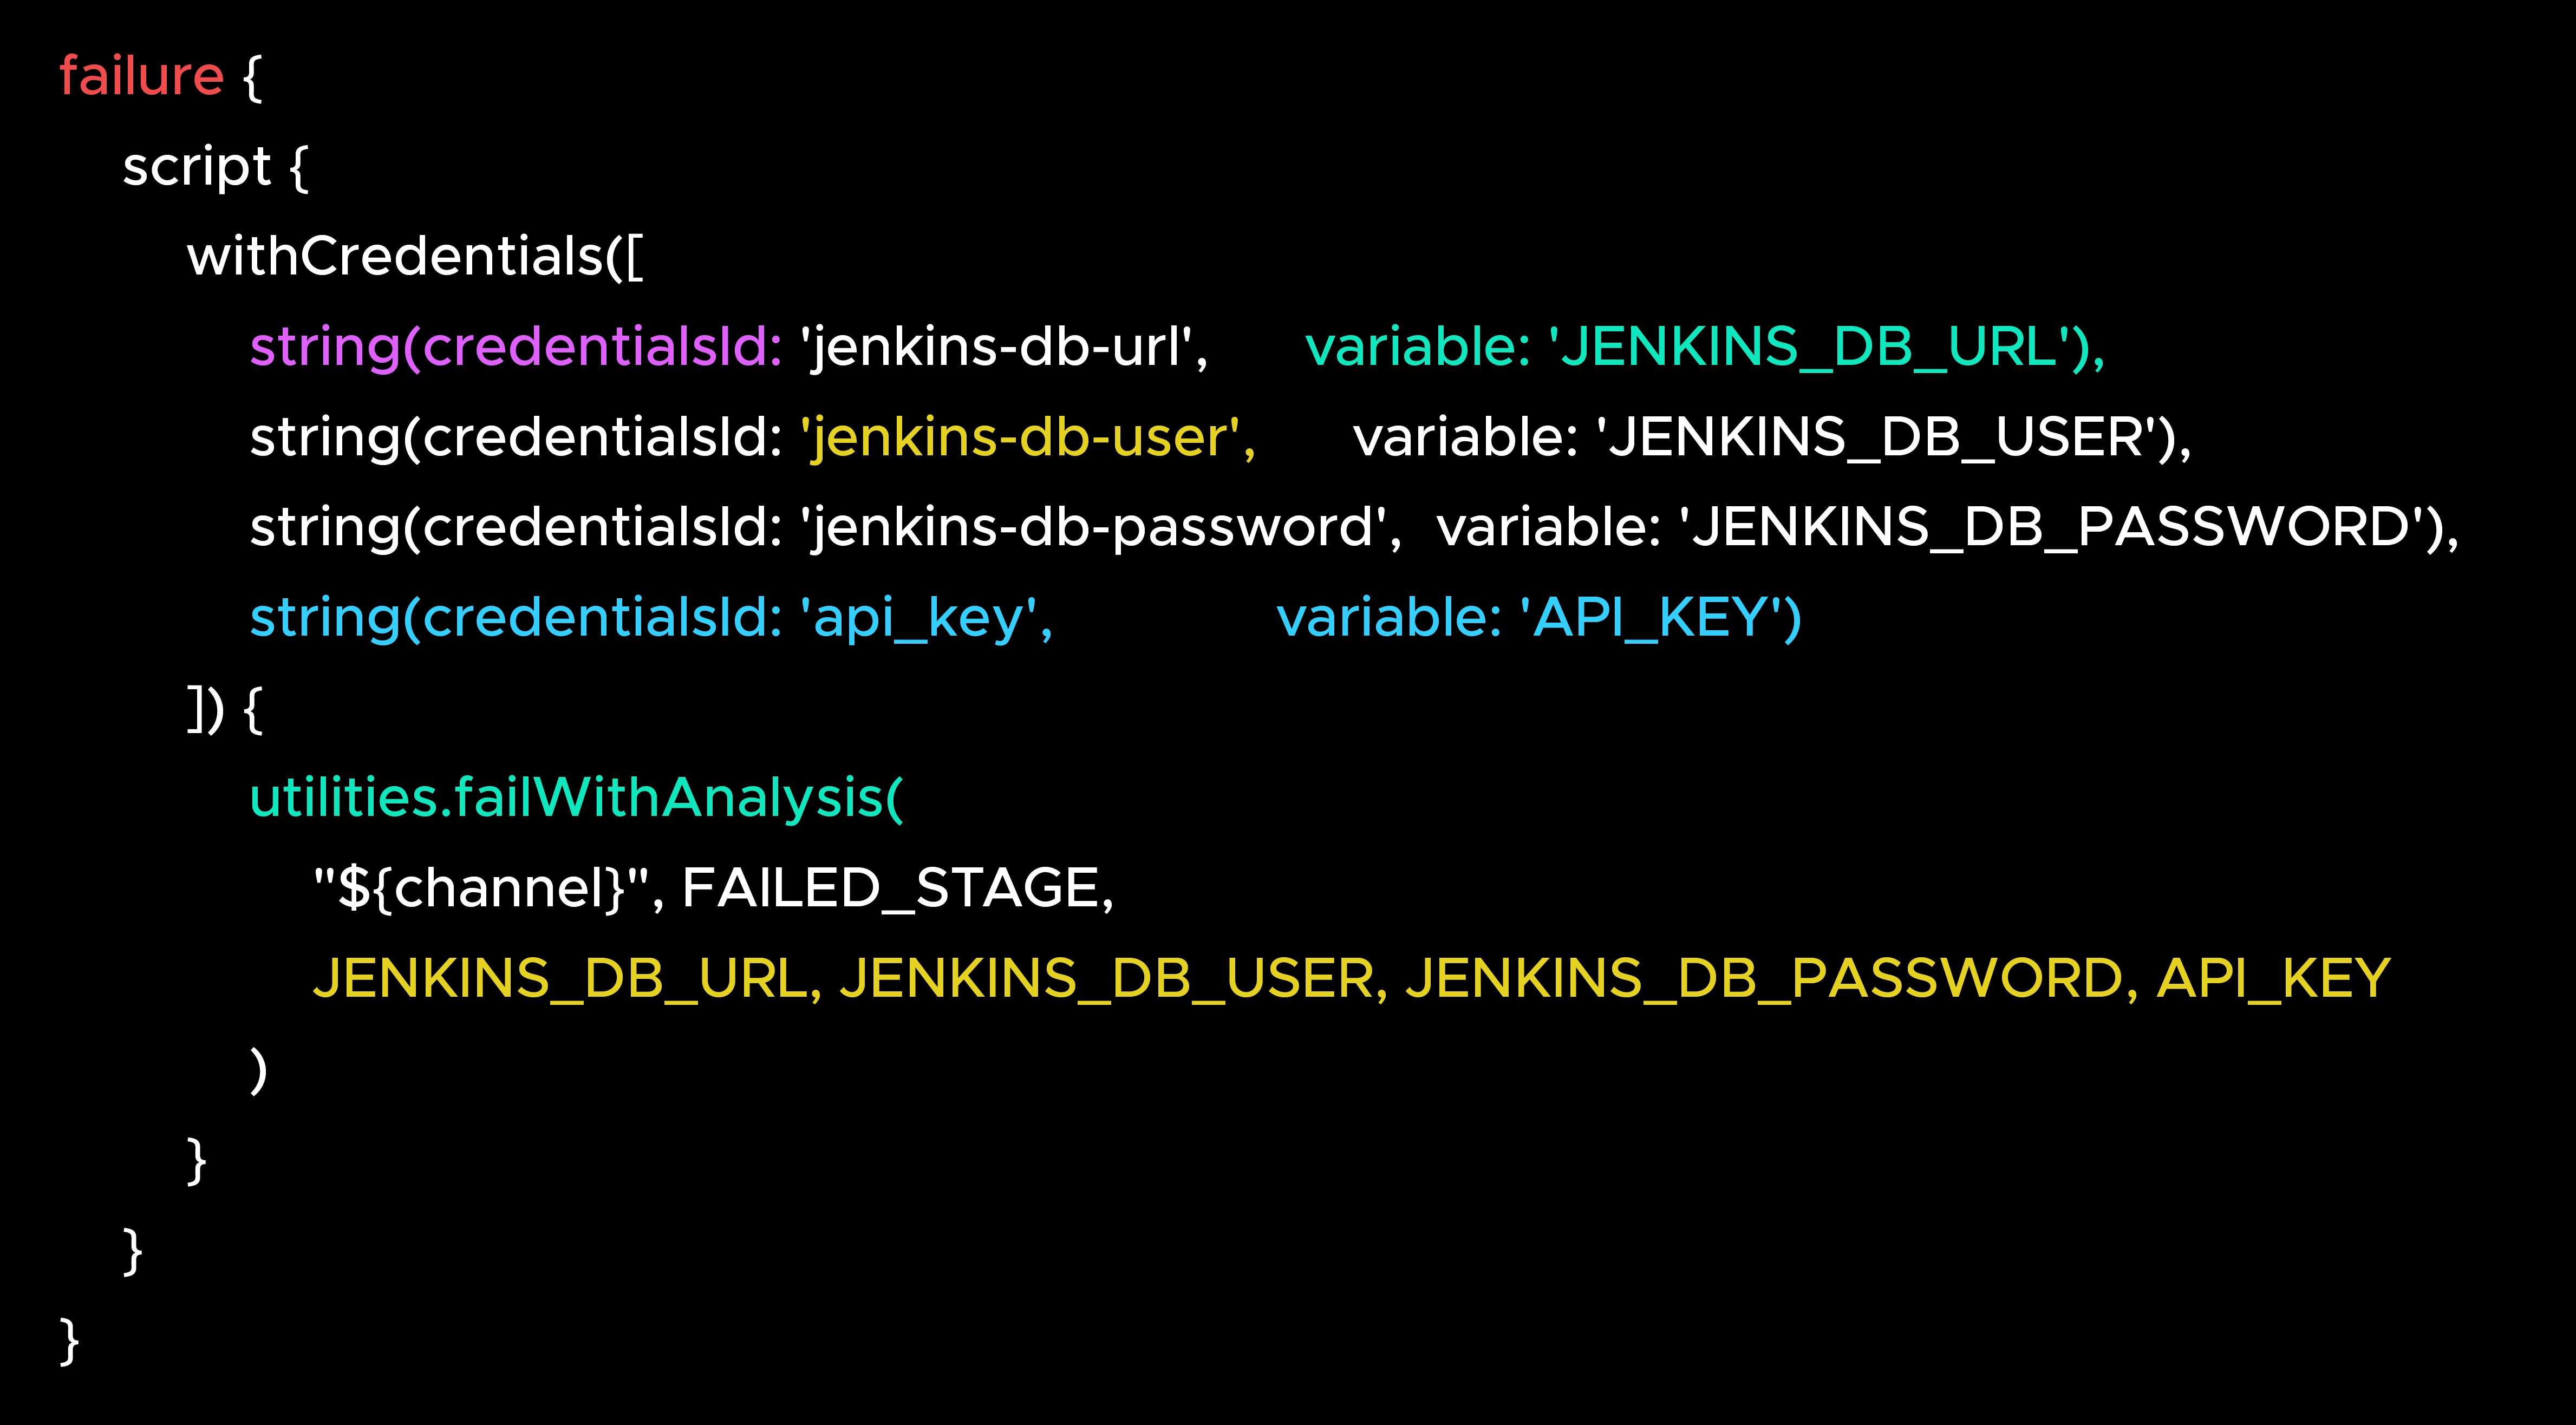
Adopting the feature in a new pipeline is a one-line change to its failure block.
This is the heart of the design, and the reason the system is fast and cheap rather than slow and costly. Every failure hits the database first. The AI is consulted only when the database has never seen the error before.
The trick that makes this work is normalization. Before looking anything up, the analyzer strips everything variable from the error text—timestamps, build numbers, file paths, workspace directories, task and container IDs, dependency version numbers, URLs—and hashes what remains. Two occurrences of the same underlying problem therefore produce the same hash, even when their raw log text differs from run to run. That hash is the key into a PostgreSQL table, build_failures.
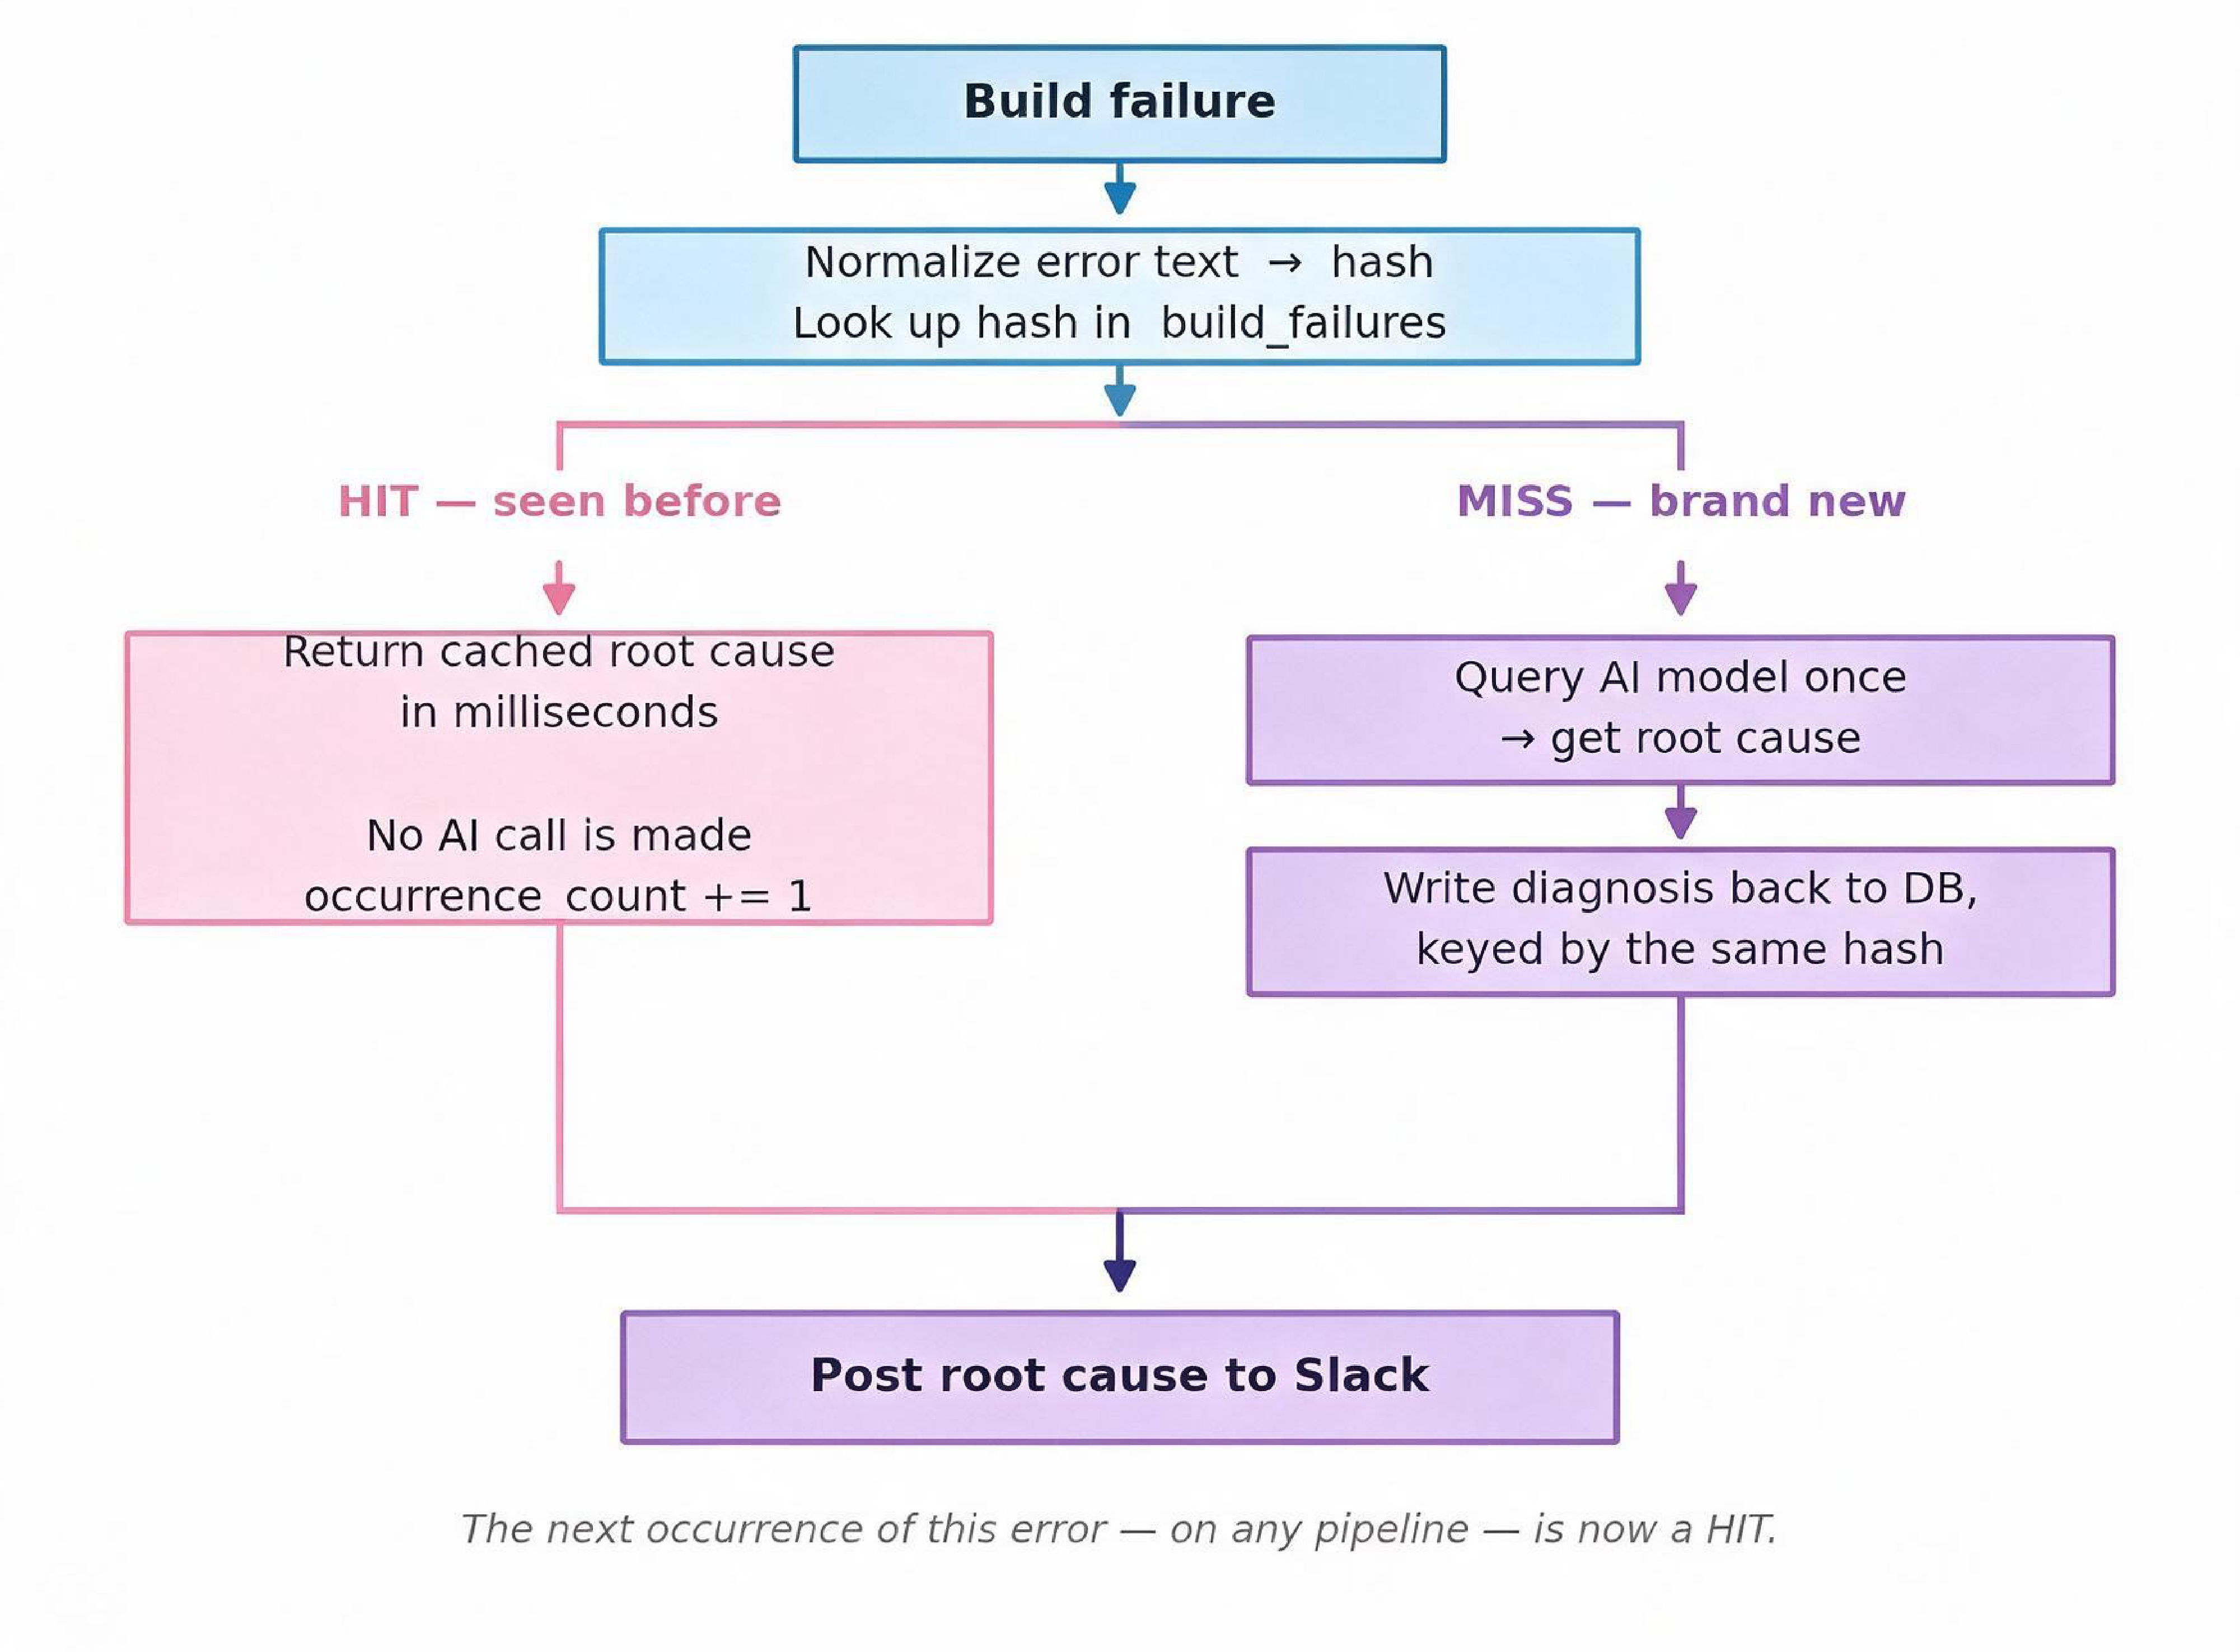
The effect compounds. Every table stores, per unique failure, the error_hash, a snapshot of the error pattern, the failed stage, the job name, the AI-generated root cause, a running occurrence_count, and timestamps. The longer the platform runs, the more failures resolve straight from memory — and that occurrence_count becomes a signal in its own right. A count that keeps climbing signals a chronic problem that needs a permanent fix.
The change engineers actually feel is the failure alert itself. Same channel, same red banner — but now it carries the answer.
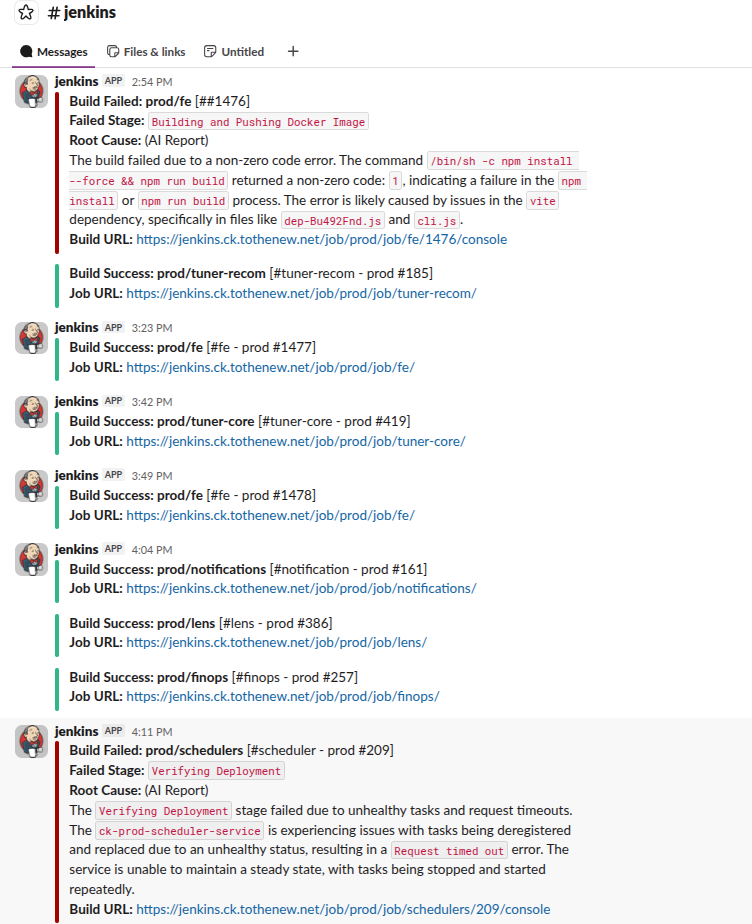
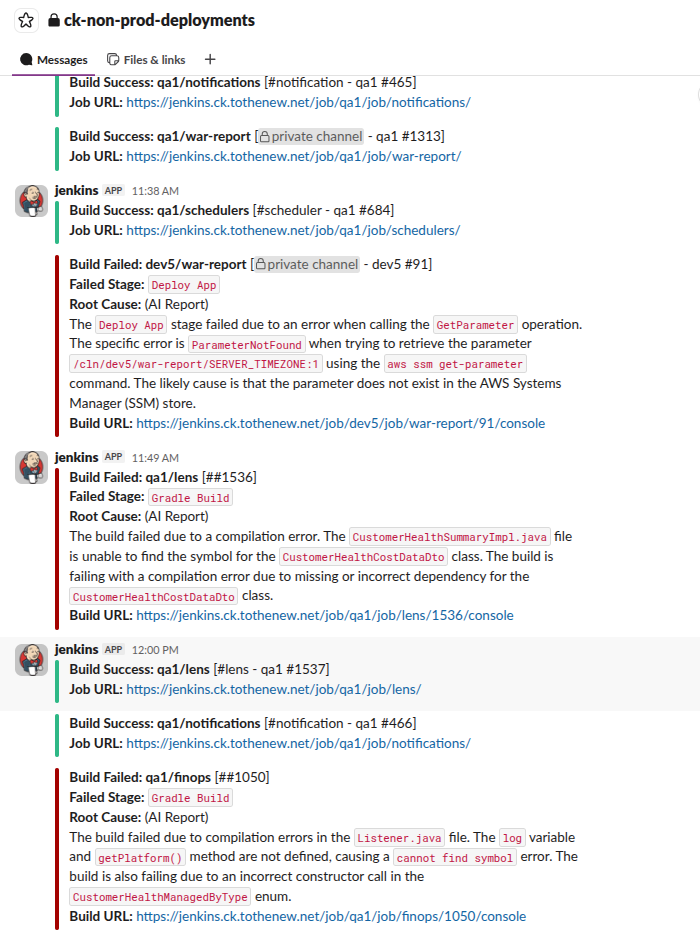
The transformation is easiest to see side by side.
From:

To: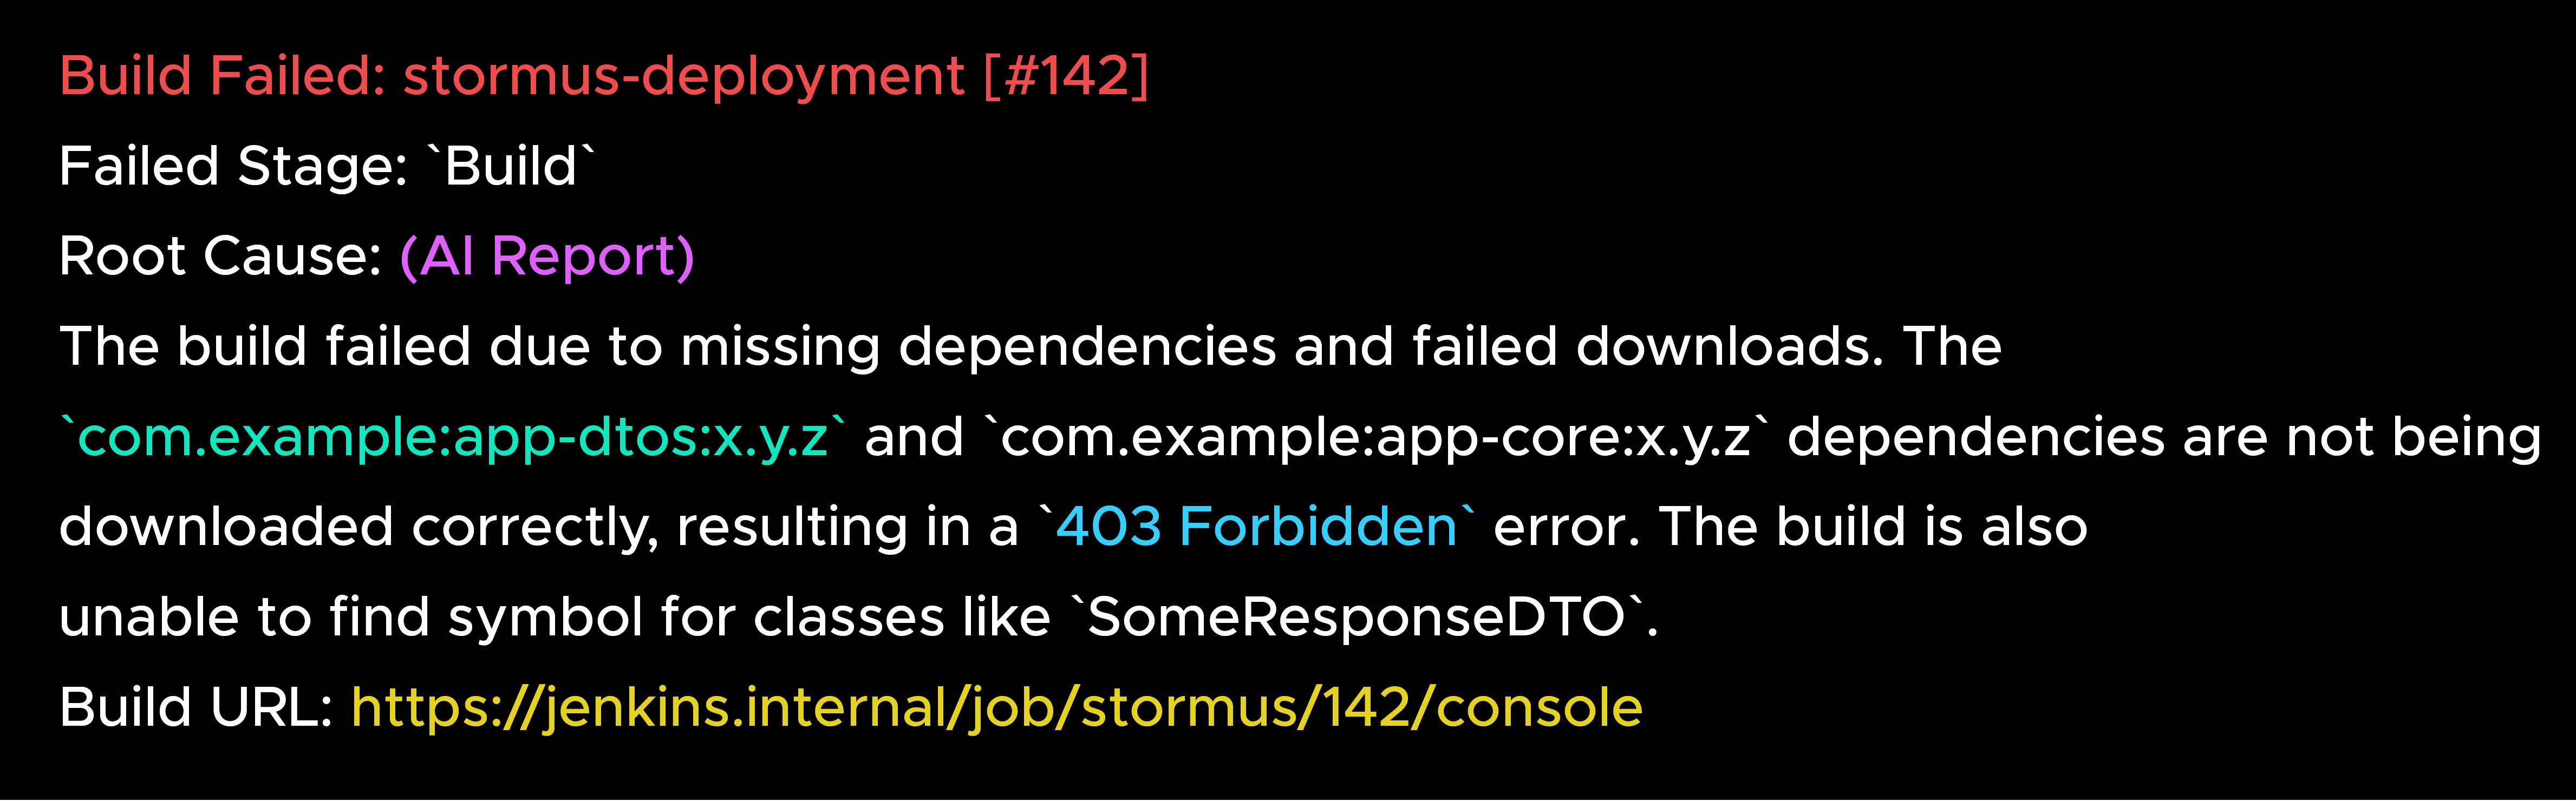
What that buys the team:
A few things stood out once it was running.
Jenkins will always tell you that a build failed. The gap has always been the distance between that red status and an actual understanding of why — and closing it, over and over, by hand, was costing us real engineering time.
The fix wasn't another alert rule or a bigger dashboard. It was to read the logs once, remember the answer, and put it where people already look. A little sanitization, a normalized cache, and a model used sparingly turned a bare failure ping into an alert that explains itself.
When a build goes red, the question was never whether something broke. It was always what. Now the answer is already in the channel, waiting to be read — not an investigation waiting to begin.
99% of companies saved up to 15% monthly with this plan & achieved peak performance.