


Find your cloud savings in under 5 minutes

Get a $100 reward on signup
Find your cloud savings in under 5 minutes
Get a $100 reward on signup

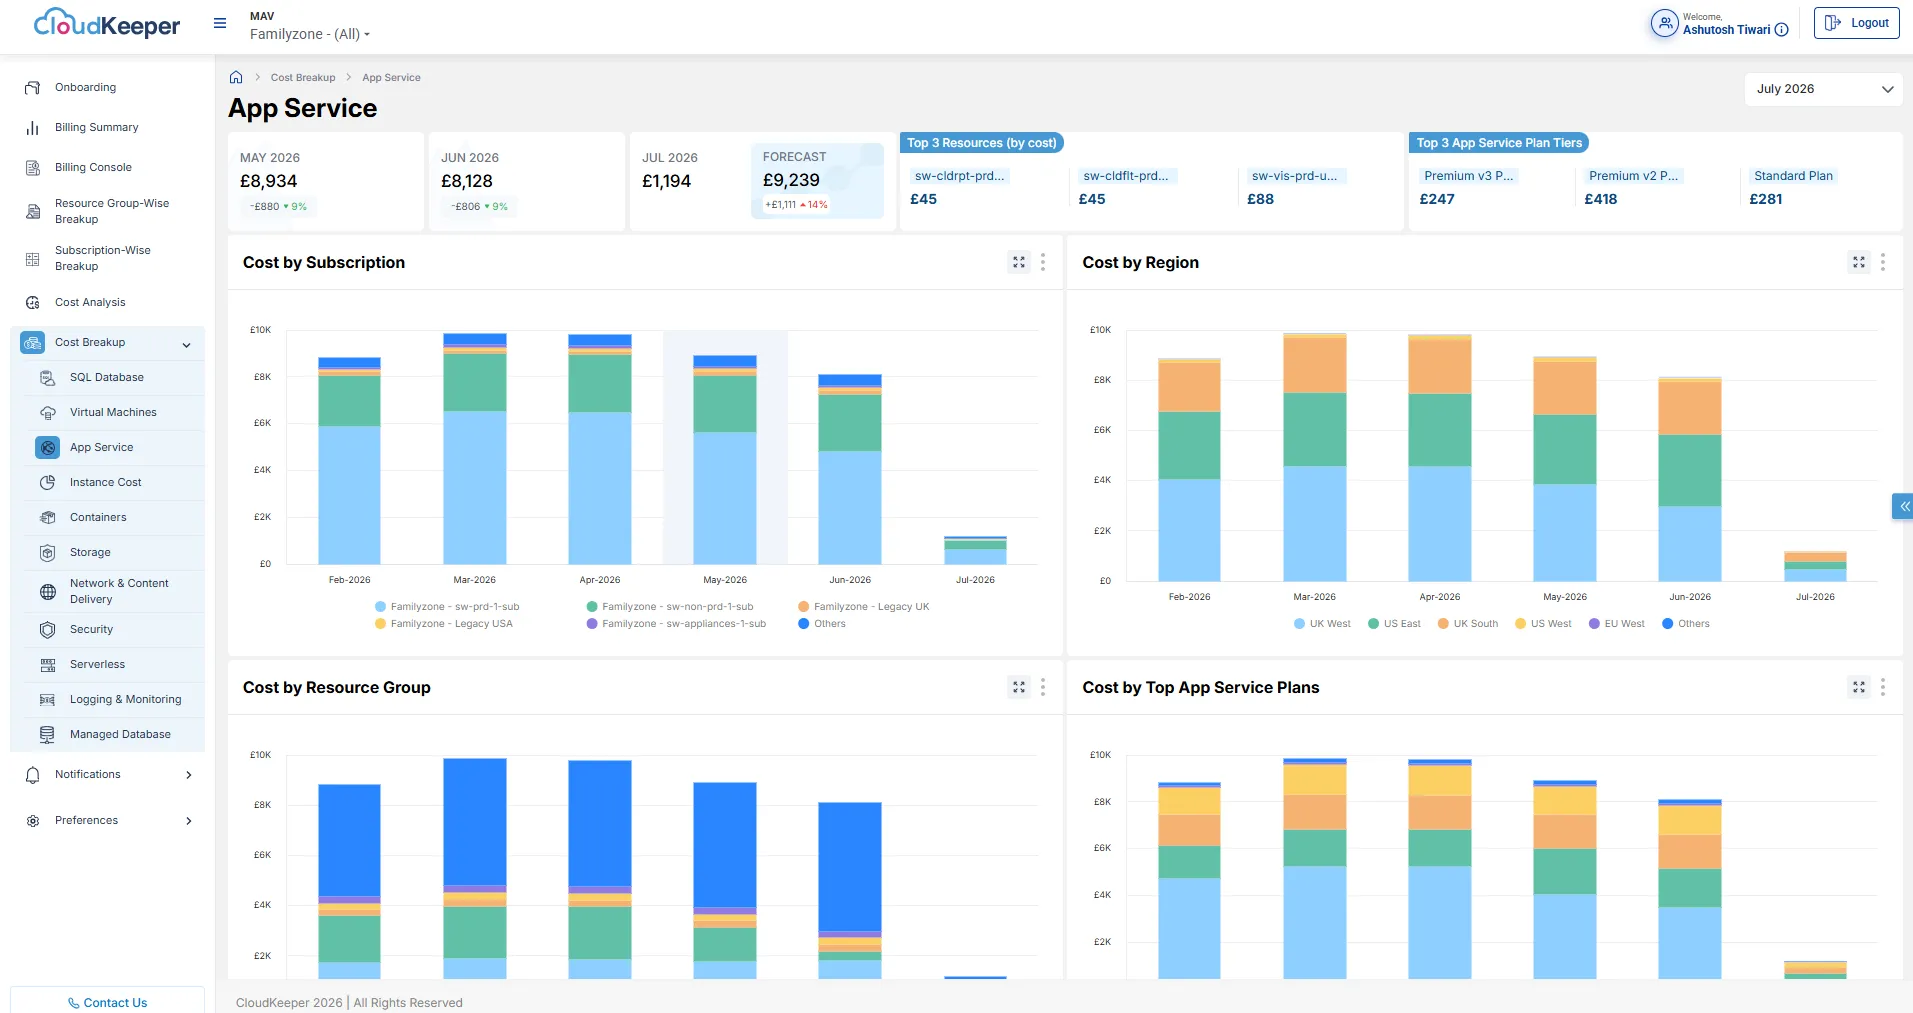
Introduced the Azure App Service Cost Breakup Dashboard to provide comprehensive visibility into App Service costs, usage patterns, and cost distribution across key dimensions.
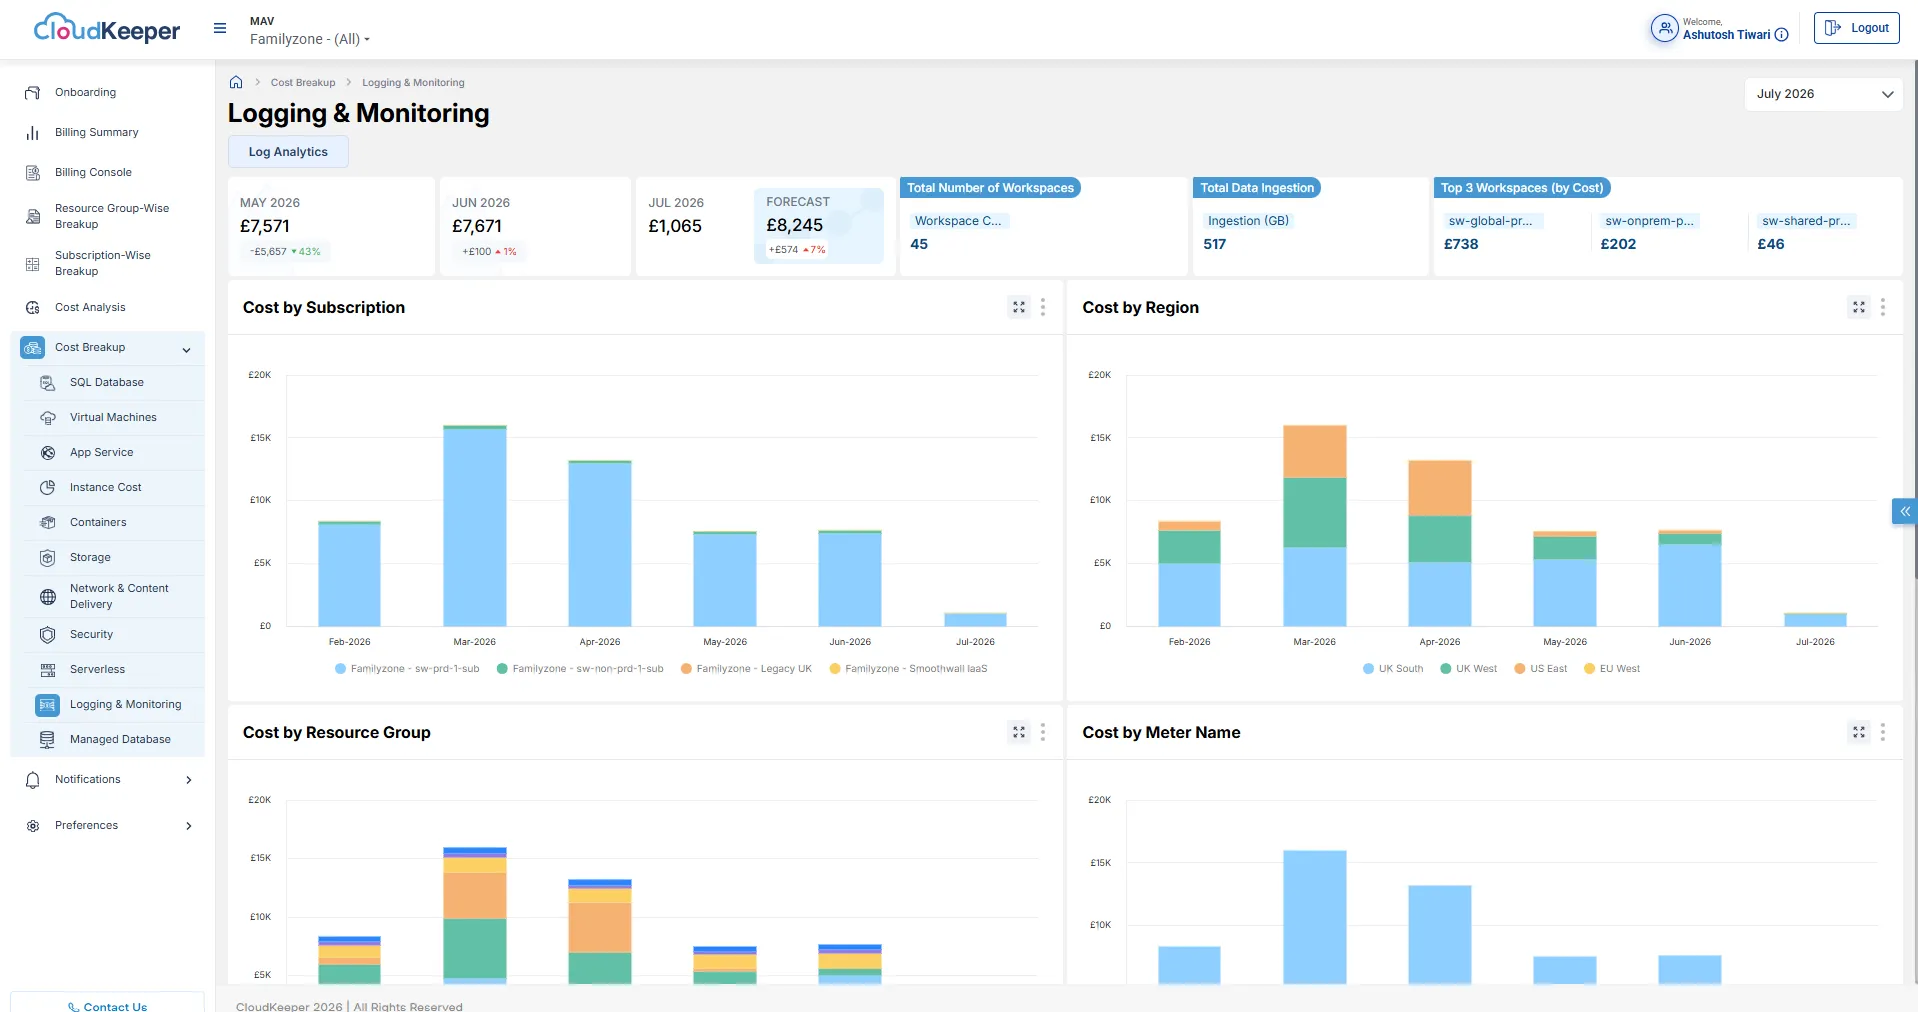
Introduced the Azure Log Analytics Cost Breakup Dashboard to provide comprehensive visibility into Log Analytics costs, workspace-level spending, and usage trends.
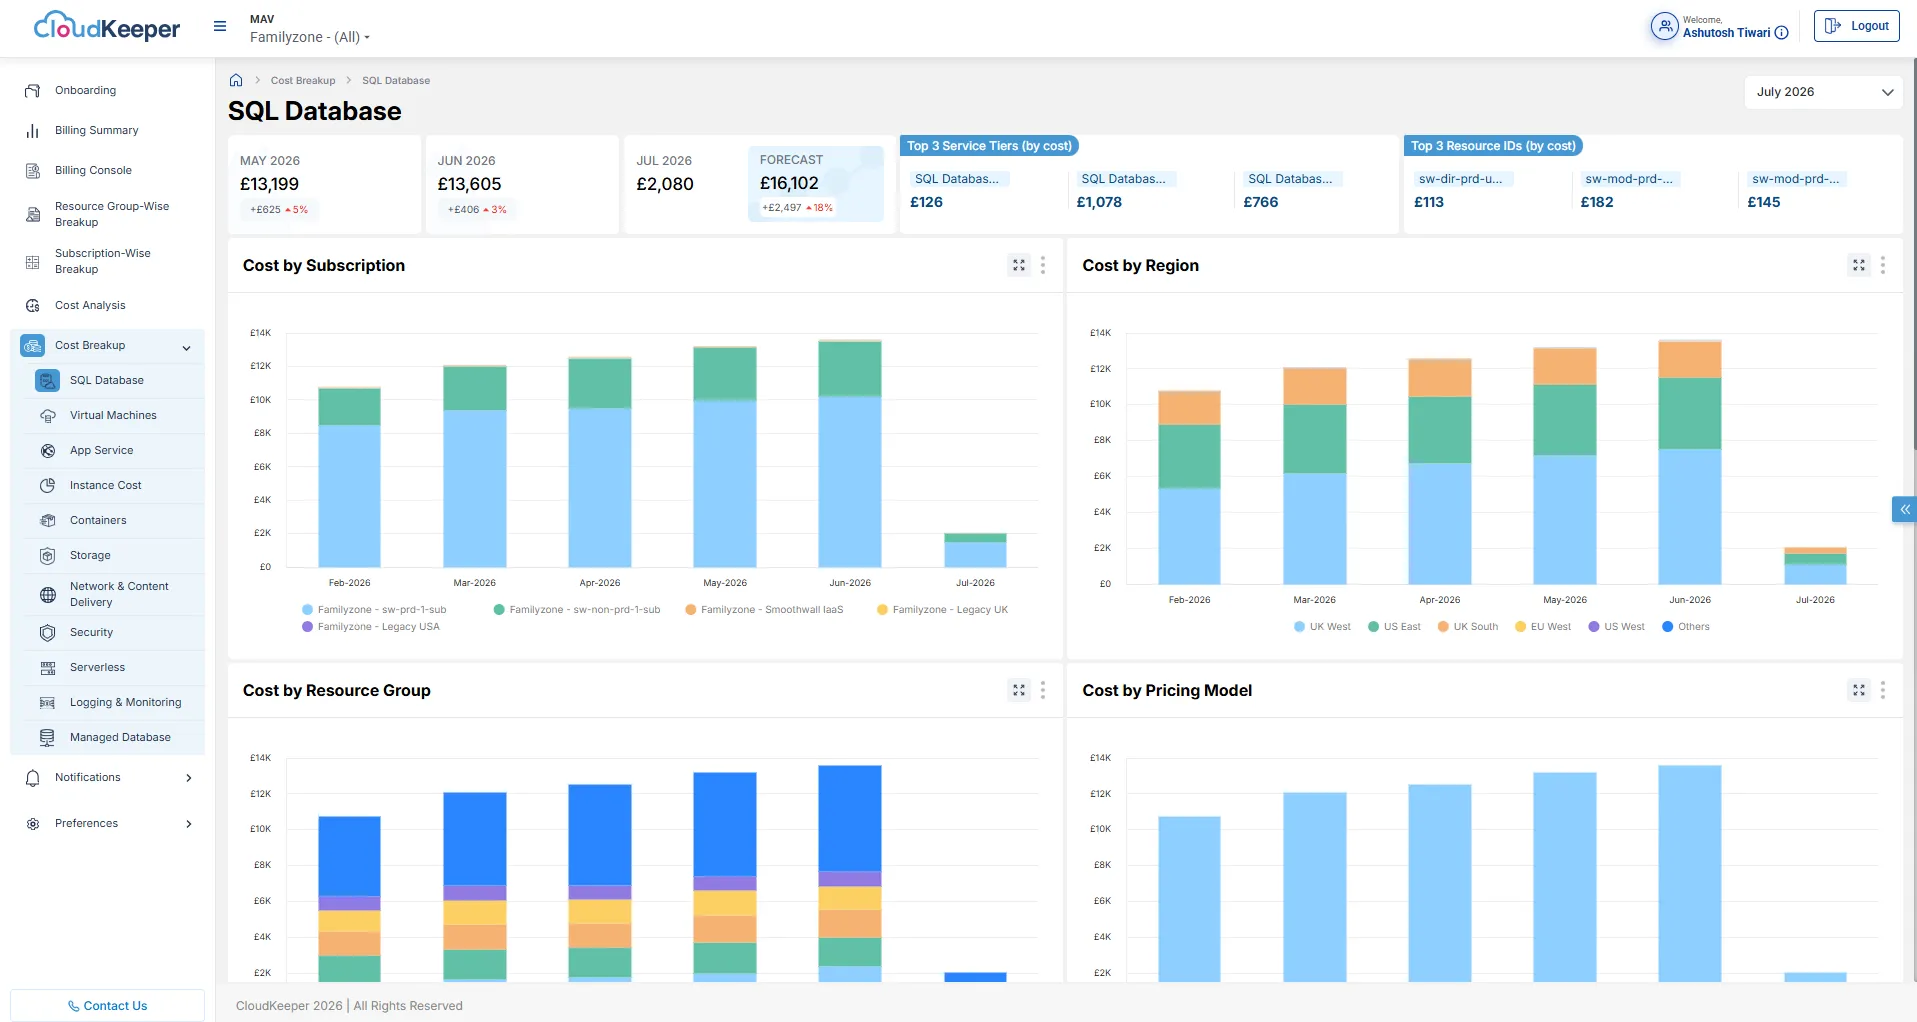
Introduced the Azure SQL Database Cost Breakup Dashboard to provide comprehensive visibility into SQL Database costs, spending trends, and service-level cost distribution.
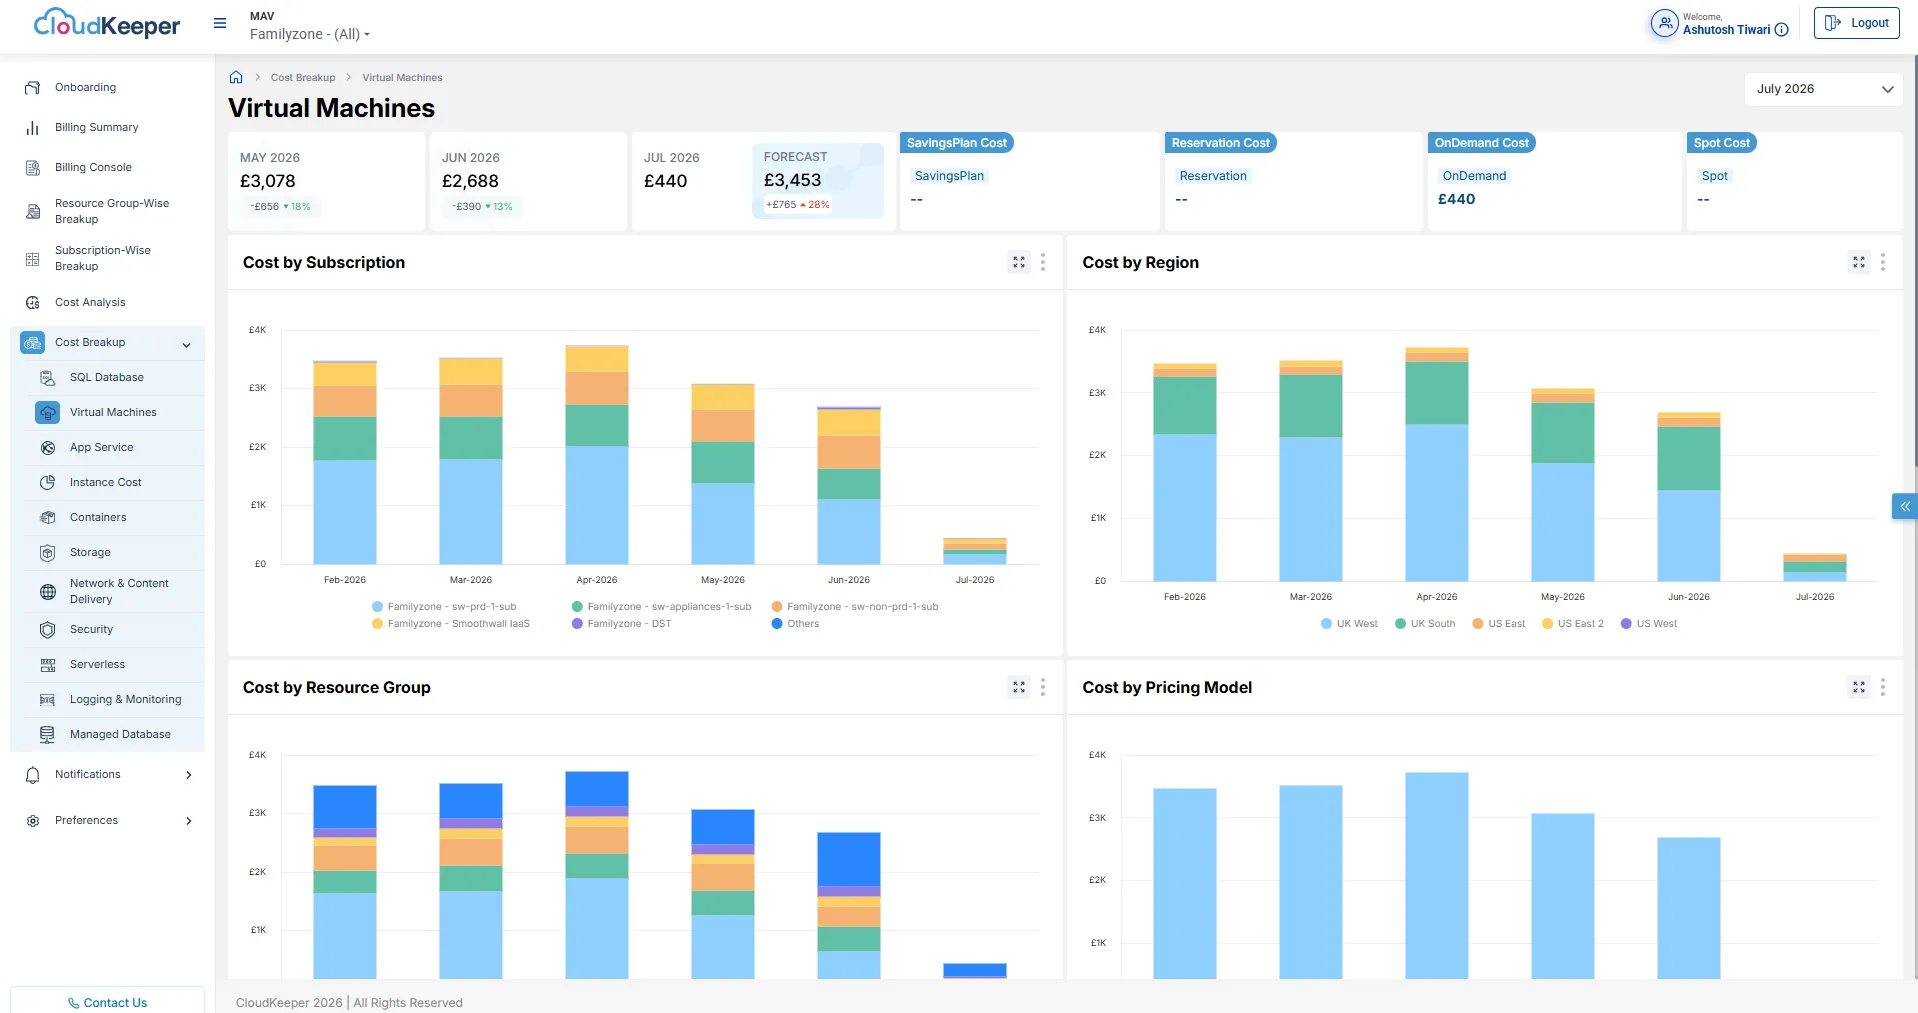
Introduced the Azure Virtual Machines Cost Breakup Dashboard to provide comprehensive visibility into Azure VM costs, spending trends, and compute cost distribution.
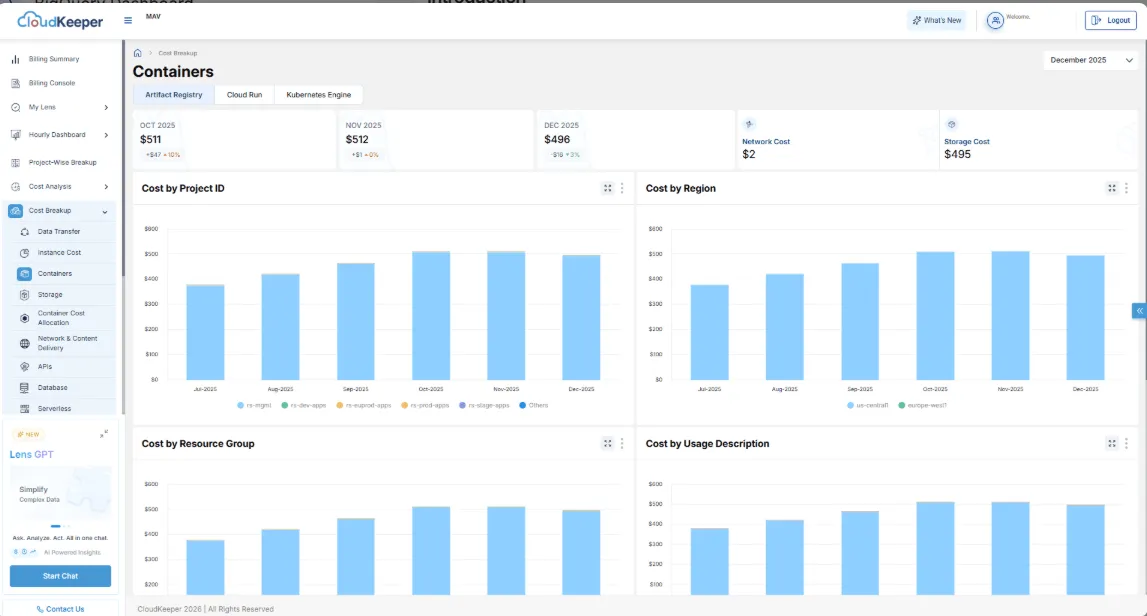
Revamped the Artifact Registry Cost Breakup Dashboard under the Containers section in GCP Lens to provide enhanced cost visibility, detailed usage insights, and comprehensive cost breakdowns.
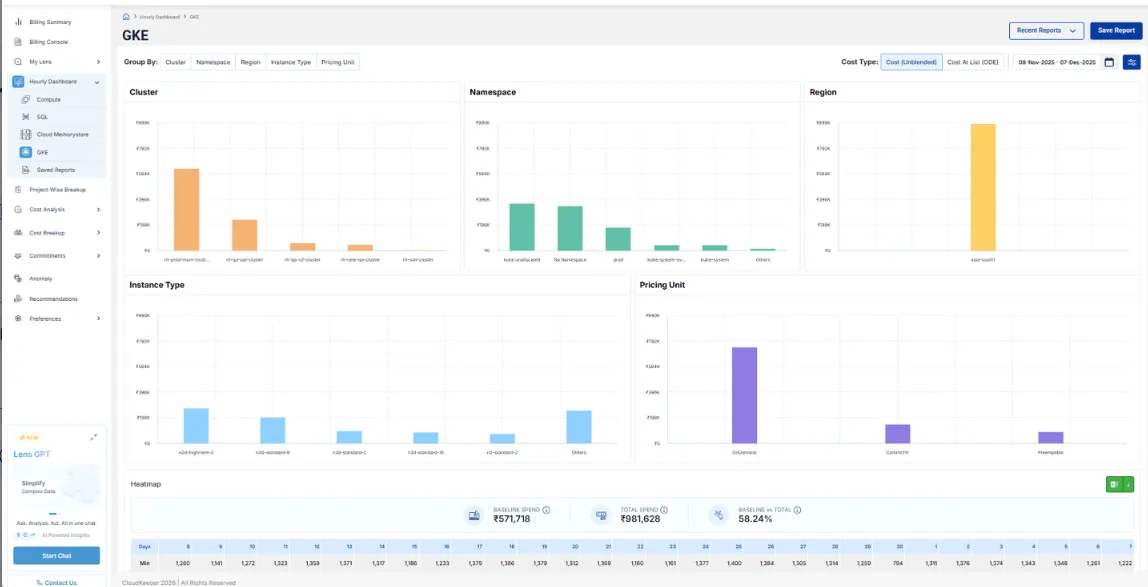
Introduced the GKE Hourly Dashboard under Hourly Dashboards in GCP Lens to provide granular visibility into Kubernetes (GKE) cost and usage trends at an hourly level.
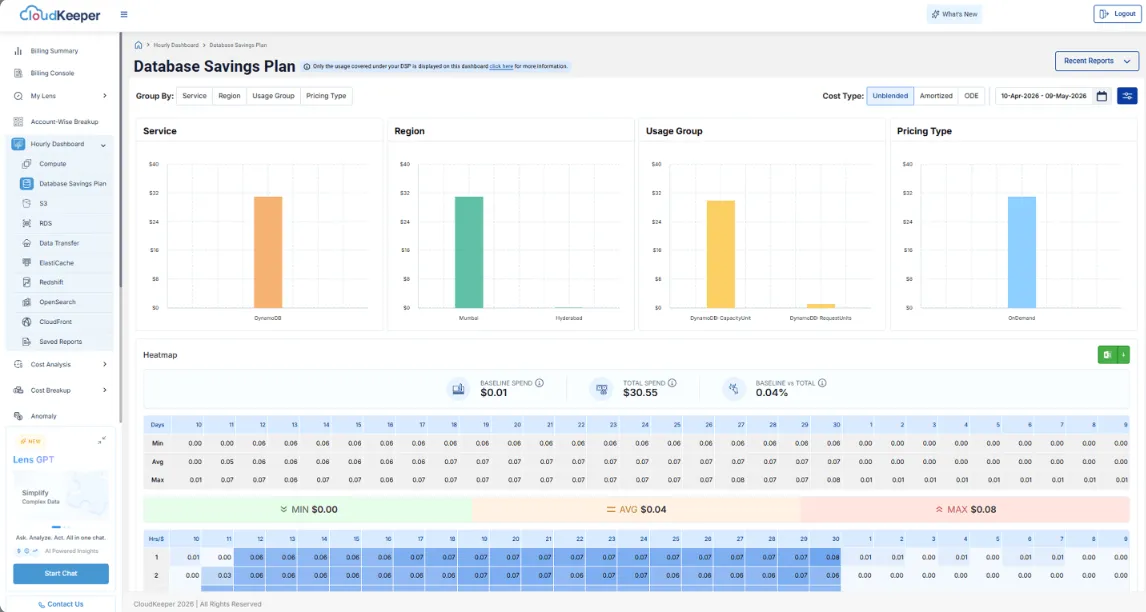
Introduced the Database Savings Plan Hourly Dashboard under Hourly Dashboards to provide hour-level visibility into Database Savings Plan costs, trends, and utilization.
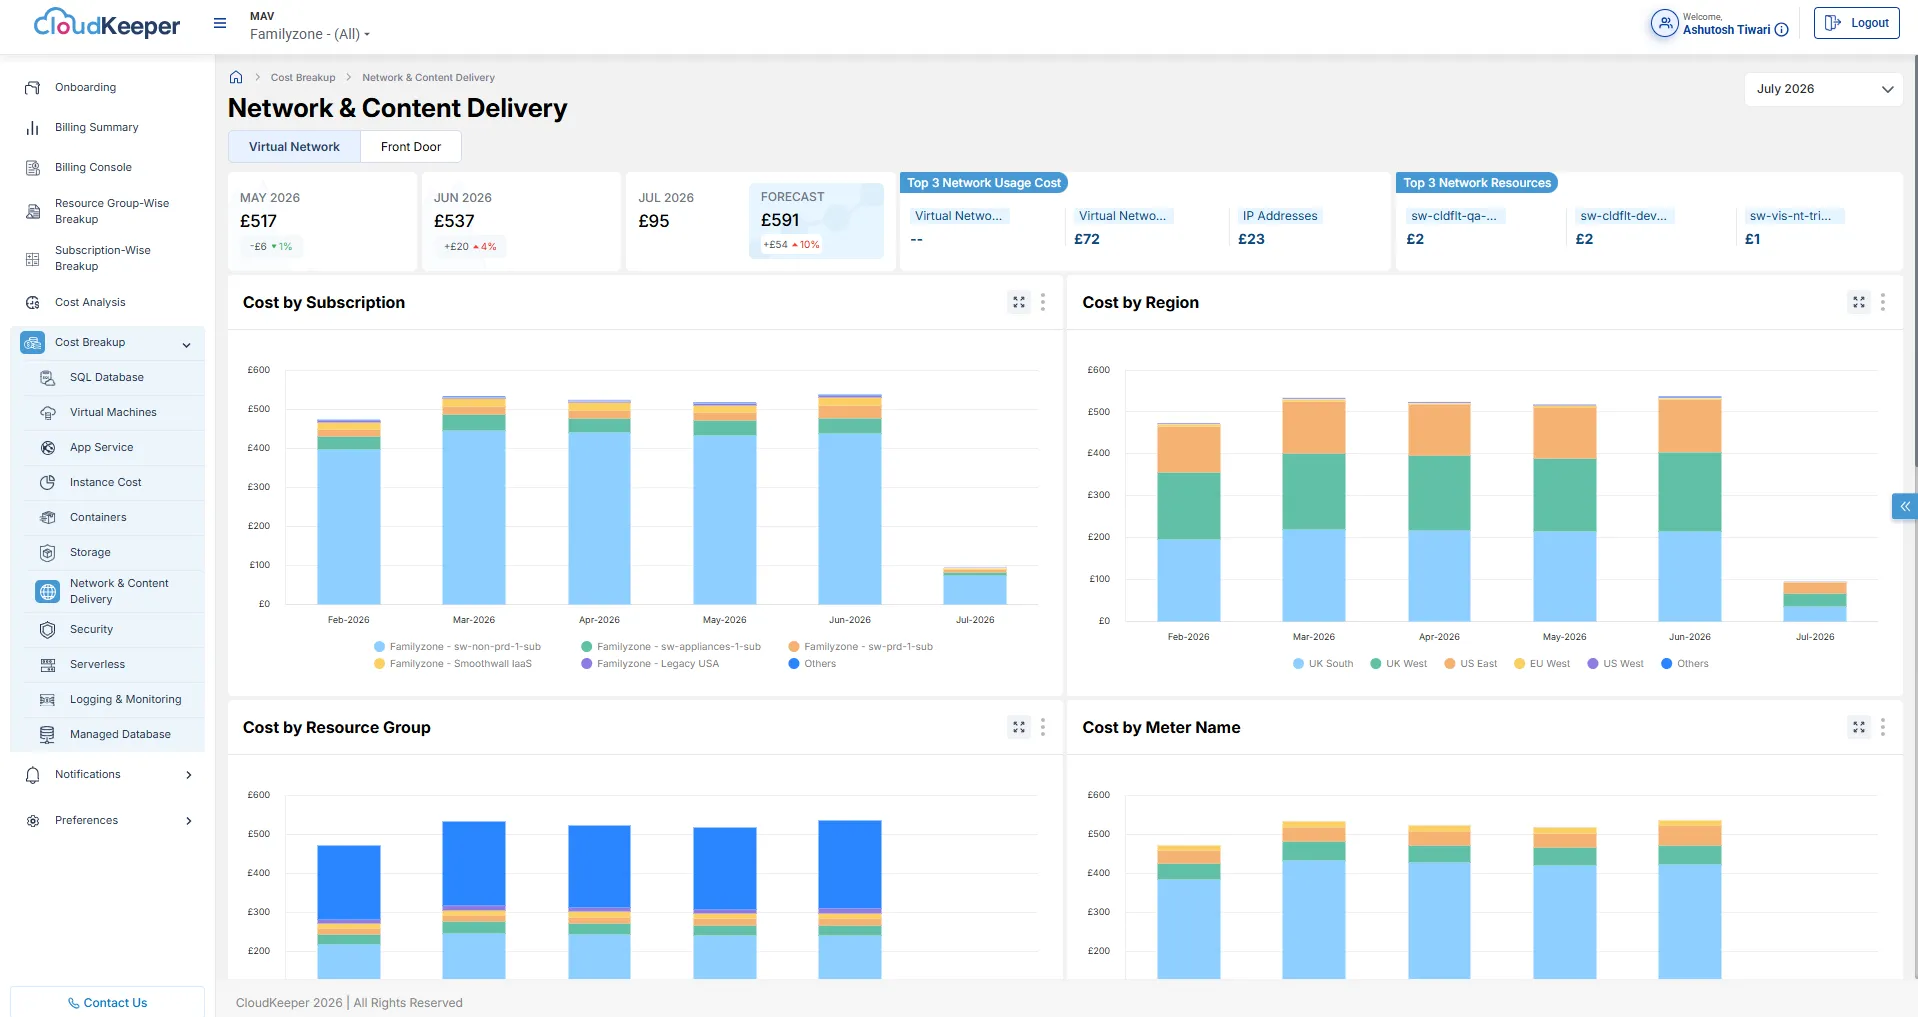
Revamped the Azure Virtual Network Cost Breakup Dashboard to provide enhanced visibility into network-related costs, detailed cost breakdowns, and improved analytical capabilities.
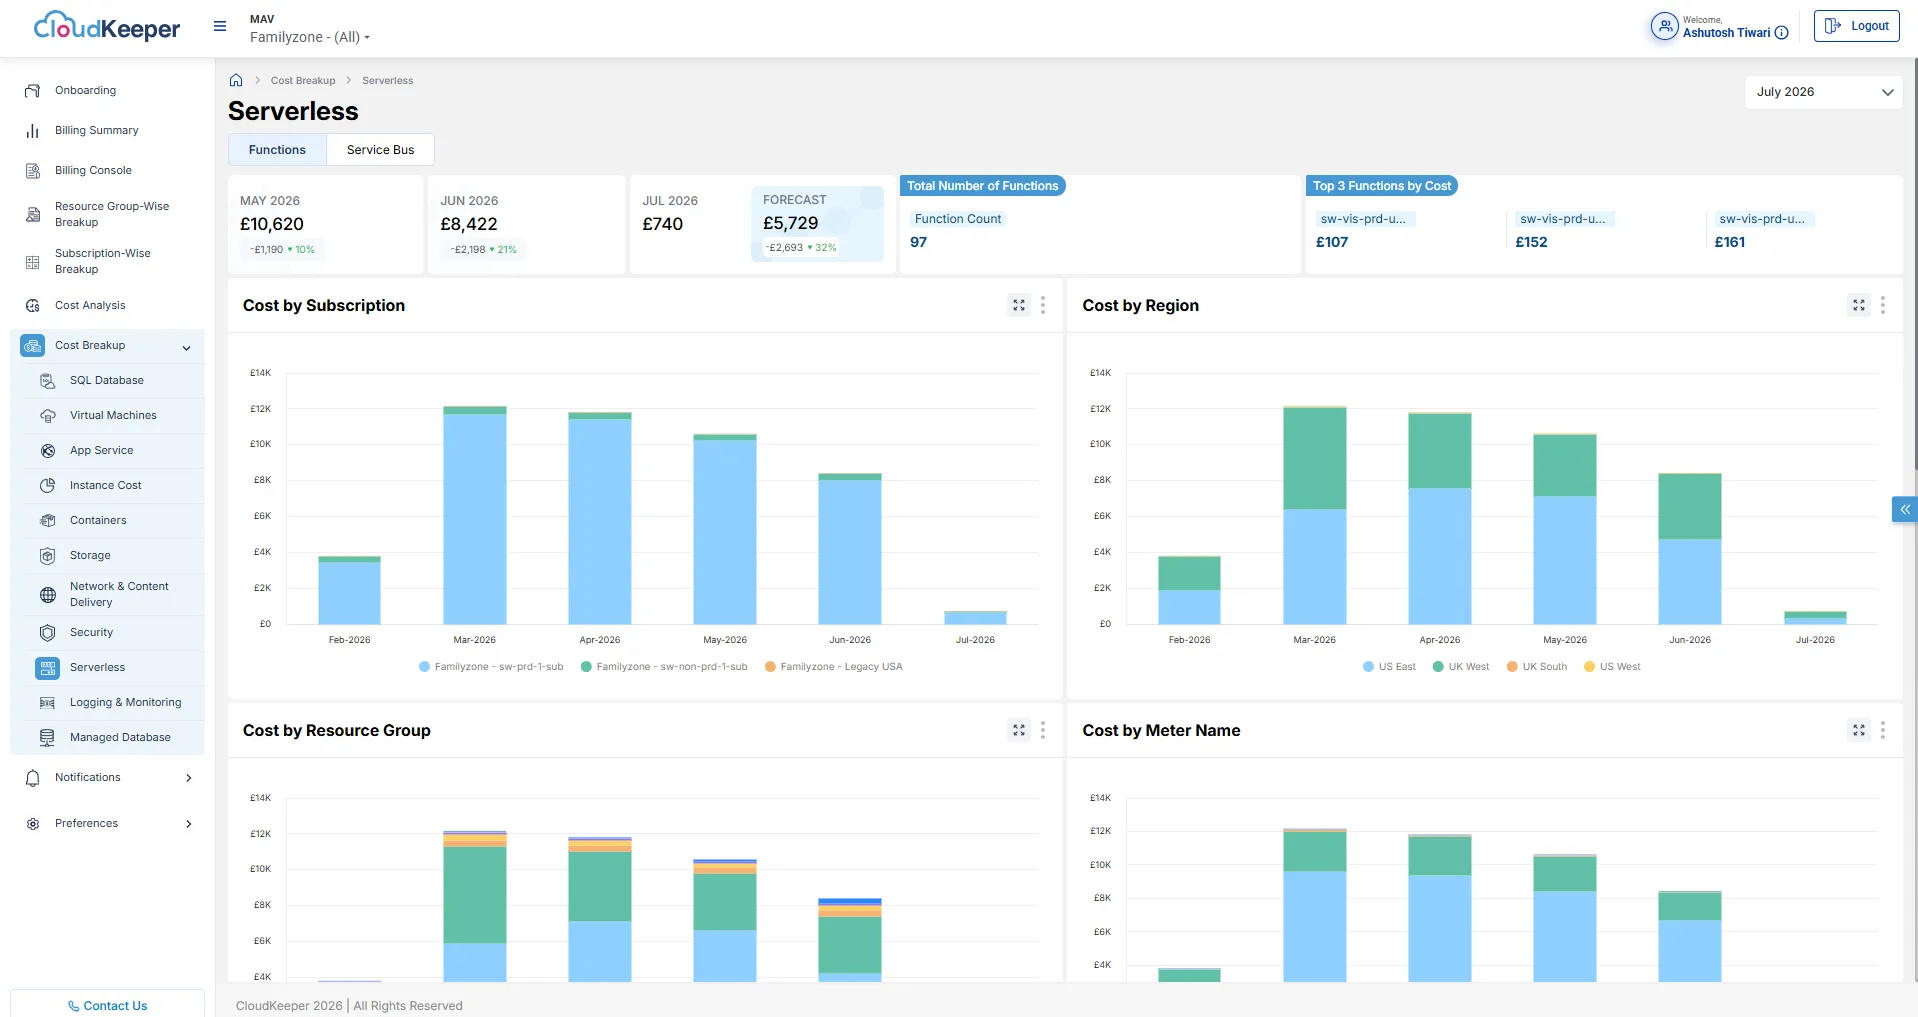
Revamped the Azure Functions Cost Breakup Dashboard to provide enhanced cost visibility, interactive analytics, and detailed usage insights across key cost dimensions.
Create and track Jira tickets directly from Tuner recommendations to accelerate resolution and streamline cost optimization workflows.


