

6
6
Table of Contents

Overview

Amazon Simple Email Service (Amazon SES) is a cloud-based email platform that lets applications send and receive mail from your own domains and addresses without operating a dedicated mail infrastructure. It is commonly used for two broad categories of traffic: transactional messages such as order confirmations, password resets, and shipping updates, and marketing communications such as newsletters and promotional campaigns.

Because Amazon SES sends from Amazon's managed infrastructure and enforces sender authentication and reputation controls, it typically delivers mail reliably, reducing the chance that legitimate mail is treated as spam. SES can also receive inbound mail and route it to Amazon S3, Amazon SNS, or AWS Lambda for downstream processing — for example, to capture customer replies or feed a support workflow.

Sending mail reliably is only half the problem. To operate an email channel with confidence, teams need visibility into what happens after a message leaves the platform: which messages were delivered, which bounced, and which recipients complained. This guide describes a practical, event-driven approach to monitoring AWS SES activity and surfacing the results to the people who need them.

Purpose and Scope

This document provides a repeatable reference for setting up end-to-end monitoring of Amazon SES sending activity within the organization. It is intended for DevOps engineers, cloud administrators, and platform teams responsible for email delivery health.

The guide covers:

  • the Amazon SES monitoring model — events, metrics, and statistics;
  • the sending events that can be tracked and what each one means;
  • a reference architecture that streams bounce and complaint events to Slack for alerting and to an ELK stack for analysis; and
  • a step-by-step implementation and operational best practices.

How Amazon SES Monitoring Works

Amazon SES exposes sending activity through three related concepts. Understanding the distinction makes it easier to decide what to capture and how to interpret it.

a) Events

An event is a single, discrete occurrence tied to a message you sent — for example, a delivery, a bounce, a complaint, or a rejection. Events are the raw signals you choose to emit, and they form the foundation for everything else. Selecting the right event types is therefore the first configuration decision.

b) Metrics

A metric is a time-ordered series built from event data. Where an event tells you that a bounce happened, a metric tells you how bounces trend over minutes, hours, or days. Metrics let you spot rising failure rates, sudden spikes, and other anomalies before they affect your sender reputation.

c) Statistics

Statistics are aggregations computed over a metric for a chosen time window. Functions such as sum, average, minimum, maximum, and sample count condense a series into a single, decision-ready figure — for instance, the average daily bounce rate over the last week. Together, events, metrics, and statistics let teams move from raw signals to data-driven decisions about email health.

Amazon SES Sending Event Types

Before enabling monitoring, decide which sending events matter for your use case. The table below summarises the event types Amazon SES can emit and what each one indicates.
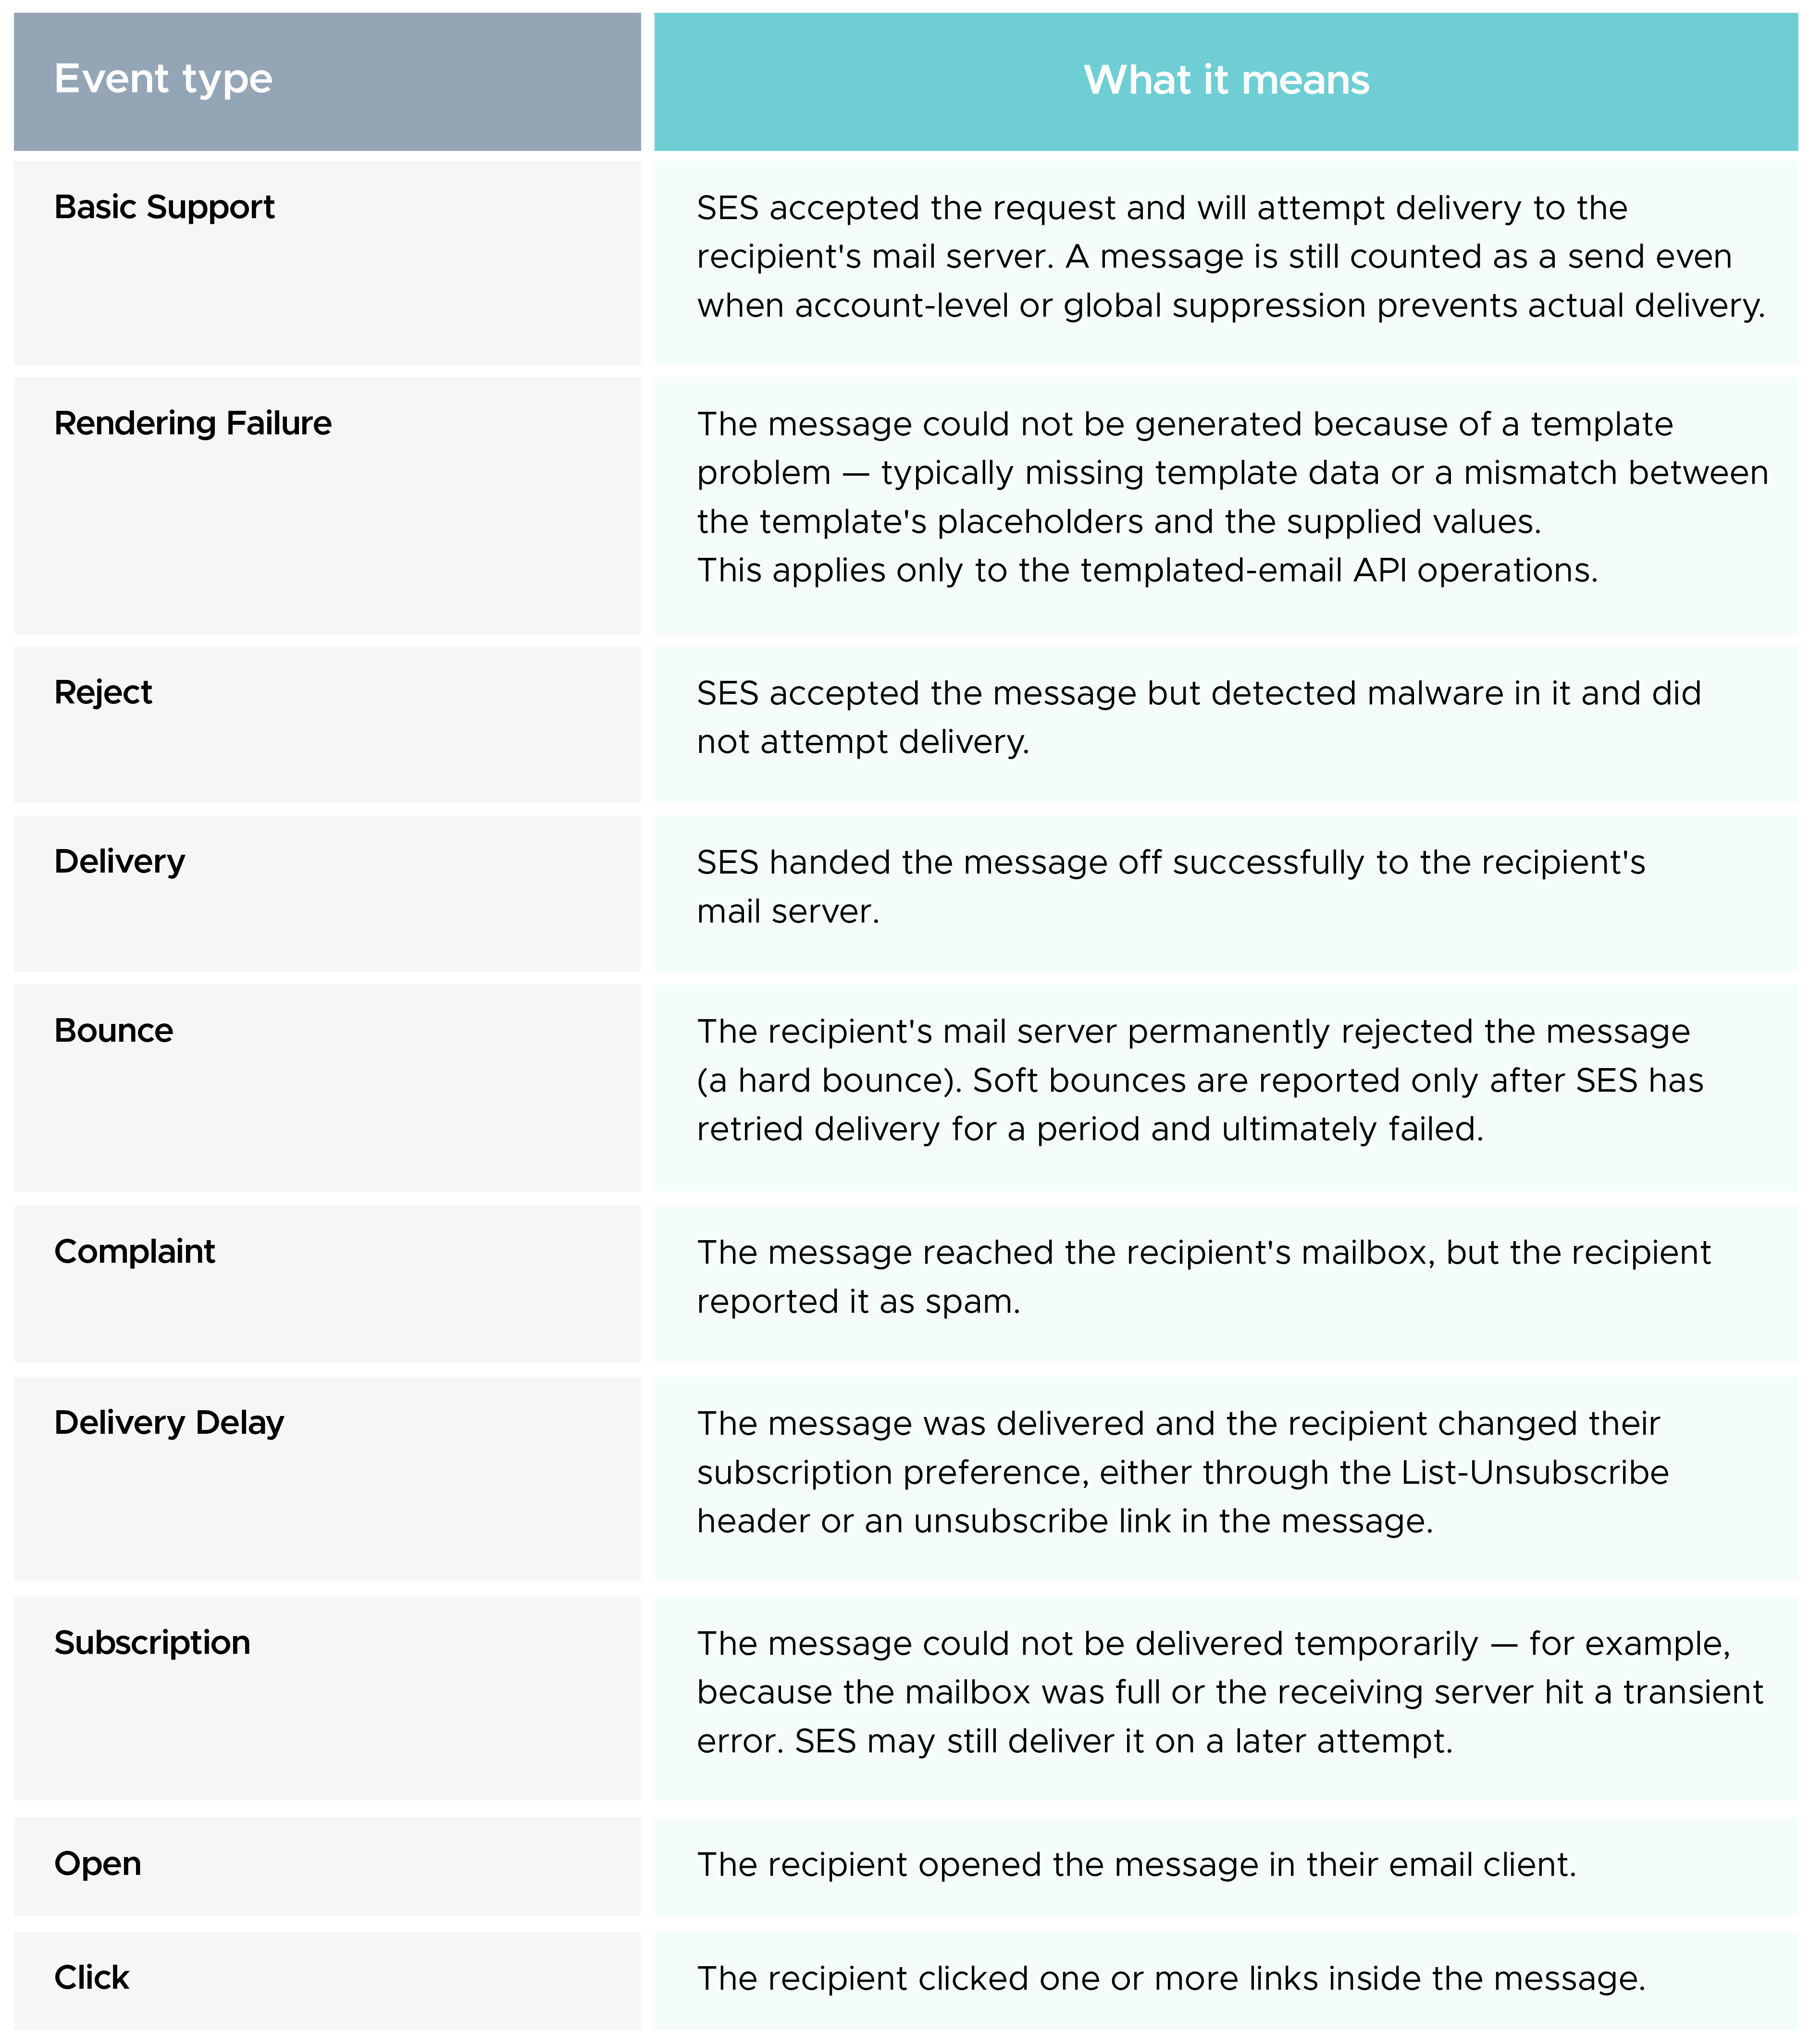
Amazon SES sending event types

Recommendation

For most operational teams, Bounce, Complaint, and Delivery are the highest-value events to alert on, because they directly affect sender reputation. Open and Click are more useful for campaign analytics than for operational health.

Reference Architecture

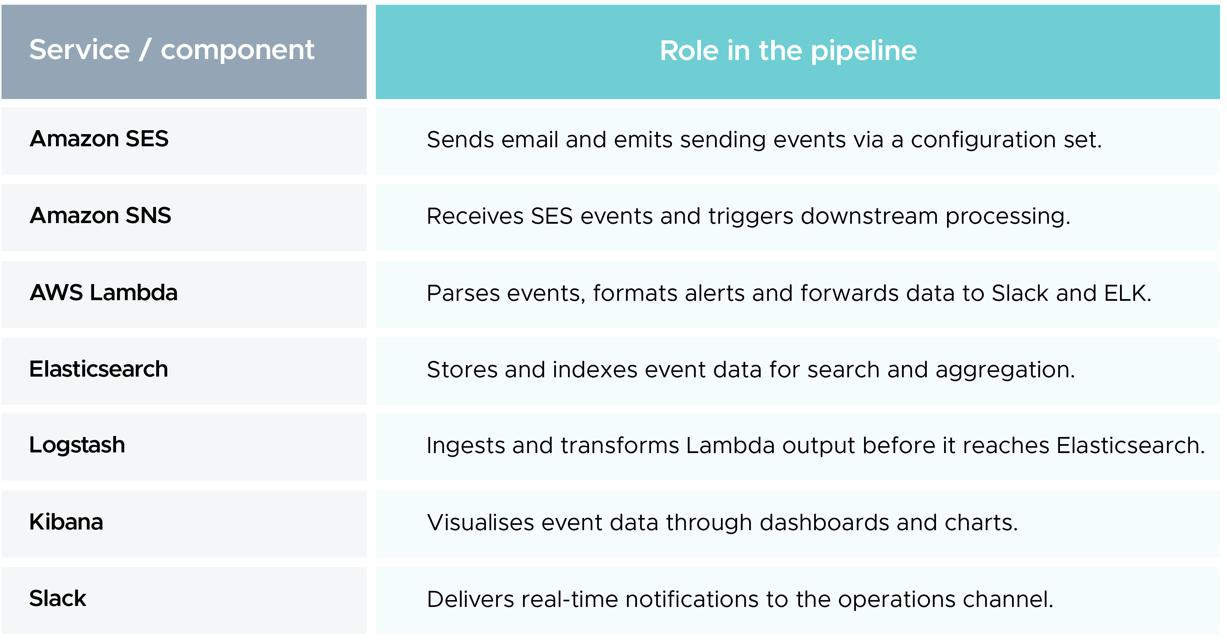
The monitoring pipeline is event-driven and fully serverless on the alerting path. AWS SES publishes selected events to an AWS SNS topic; AWS SNS invokes a Lambda function; the function pushes a human-readable alert to Slack and forwards structured event data to an ELK stack for dashboards and historical analysis.

Reference Architecture

At a high level:

  • Capture — A configuration set on Amazon SES defines which events are emitted and where they are sent.
  • Transport — Amazon SNS fans the events out and decouples Amazon SES from the processing logic.
  • Process — Amazon Lambda parses each event and routes it to the right destination. To learn how to reduce AWS Lambda costs, click here
  • Deliver — Slack receives real-time alerts; Kibana provides trends and history.

Required AWS Services and Components

Required AWS Services and Components

Implementation Guide

The following steps set up the full pipeline. The example focuses on bounce events, but the same pattern applies to complaints, deliveries, and any other event type you enable.
Step 1 — Create an AWS SES configuration set

  1. In the AWS SES console, create a configuration set for your sending identity.
  2. Enable the event types you want to track — for this example, include Bounce.
  3. Add an event destination that points to the SNS topic created in Step 2.

Step 2 — Create an AWS SNS topic

  1. Open the Amazon SNS console and create a new topic with a descriptive name.
  2. Record the topic ARN; you will reference it from AWS SES and Amazon Lambda.
  3. Confirm the topic policy allows AWS SES to publish to it.

Step 3 — Create the Lambda function

  1. Create a Lambda function in your preferred runtime, such as Python or Node.js.
  2. Add the SNS topic as the function's trigger so each event invokes it.
  3. Store the Slack webhook URL as an environment variable rather than in code.

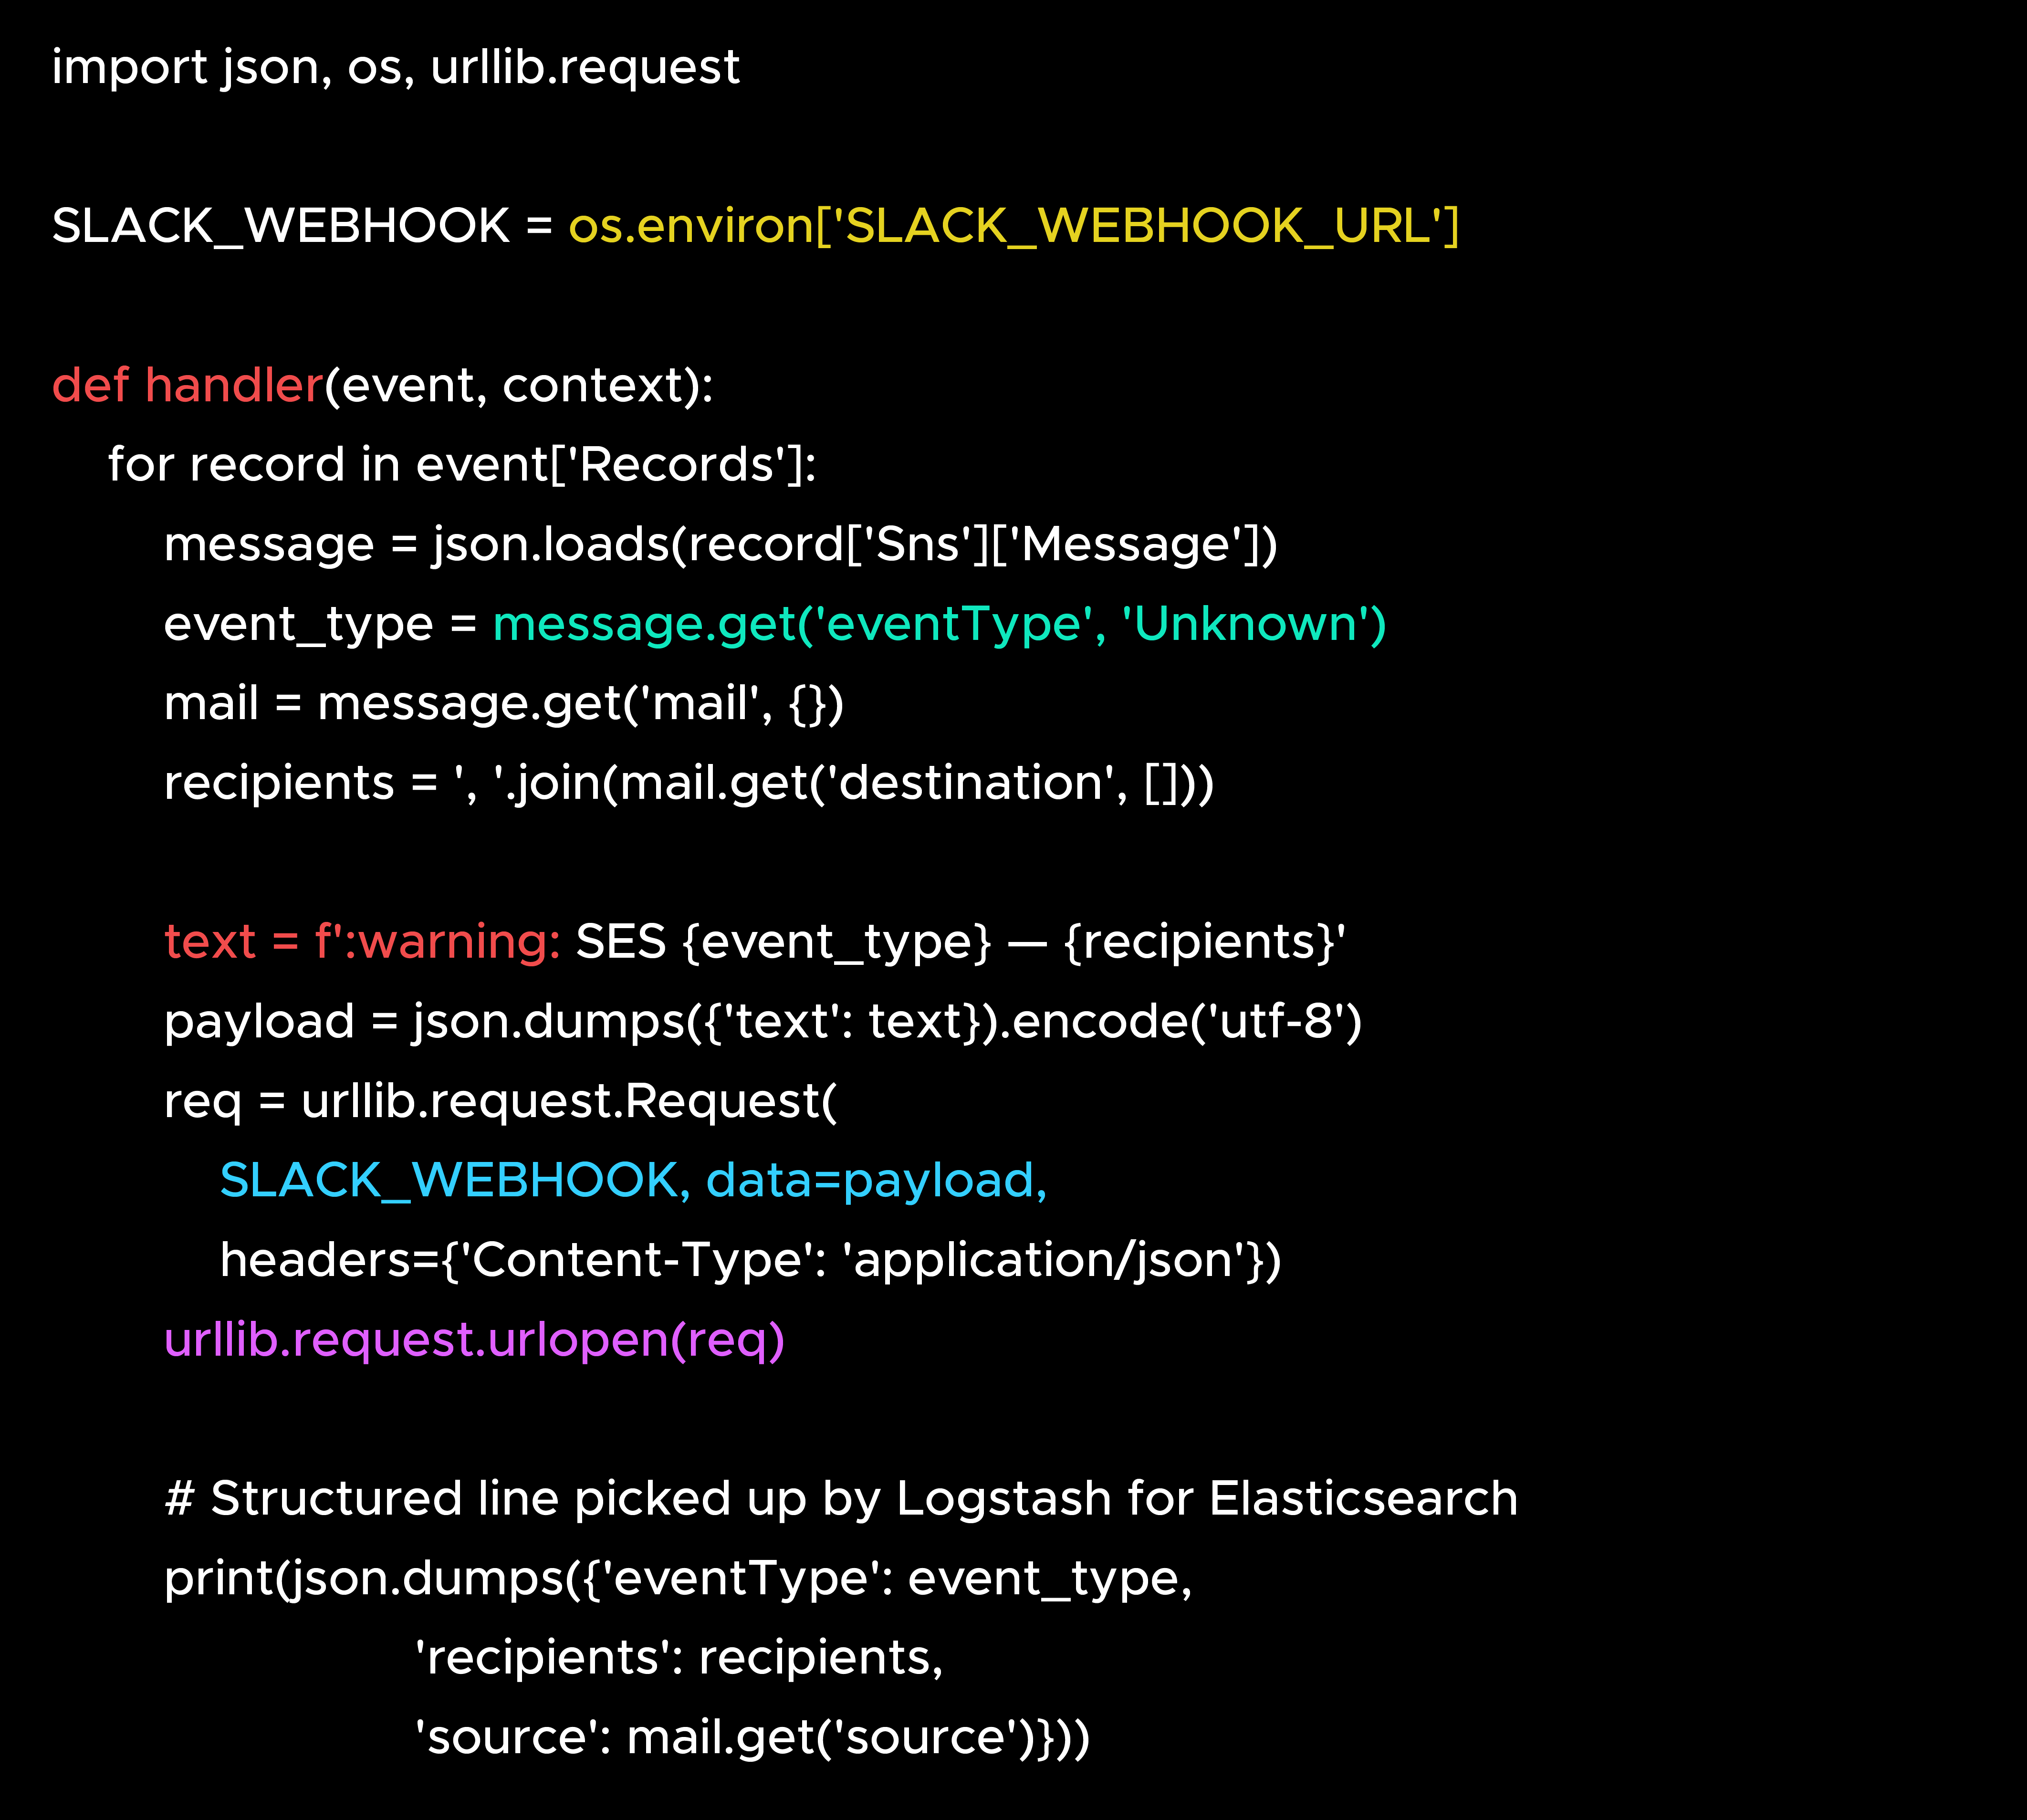
Step 4 — Write the processing logic

  1. Parse the AWS SNS message payload to extract the event type and message details.
  2. Build a concise, readable alert from the relevant fields.
  3. Post the alert to Slack using an incoming webhook, and emit a structured log line for AWS ELK ingestion.

Write processing logic

Step 5 — Configure the IAM role

  1. Attach an execution role to the Lambda function granting only the permissions it needs — for example, reading from AWS SNS and writing logs.
  2. Follow least-privilege principles; avoid broad wildcard permissions.

Step 6 — Test and deploy

  1. Invoke the function with a sample SNS bounce payload to confirm the Slack alert and log output are correct.
  2. Send a controlled test email that triggers a bounce (for example, to the AWS SES mailbox simulator) and verify the end-to-end flow.
  3. Deploy the function once validated.

Step 7 — Set up the AWS ELK stack

  1. Provision AWS Elasticsearch, Logstash, and Kibana on EC2 or a managed service.
  2. Configure Logstash to ingest the structured logs Lambda emits.
  3. Ensure each record carries the fields needed to analyze bounce events.

If you're not smart about using AWS Elasticsearch, costs can spiral quickly. To learn how to reduce AWS Elasticsearch costs, click here

Step 8 — Forward data to Elasticsearch

  1. Define a Logstash pipeline that parses the Lambda output and indexes it into Elasticsearch.
  2. Validate that documents appear in the expected index with correct fields.

Step 9 — Build Kibana dashboards

  1. Create Kibana visualizations for bounce volume, bounce rate, and top affected domains.
  2. Combine them into a dashboard the team can use for daily review.

Operational Best Practices

  • Protect reputation — Keep bounce and complaint rates within AWS thresholds; sustained breaches can lead to sending restrictions.
  • Suppress bad addresses — Automatically add hard-bounced and complained addresses to a suppression list to avoid repeat sends.
  • Secure credentials — Store secrets such as the Slack webhook in environment variables or a secrets manager, never in source code.
  • Least privilege — Grant each component only the permissions it requires.
  • Tune alerting — Alert on rate thresholds rather than individual events to reduce noise while still catching real problems.
  • Manage retention — Set index lifecycle policies in Elasticsearch so historical data is retained cost-effectively.

Summary

By combining SES configuration sets, AWS SNS, Lambda, Slack and the AWS ELK stack, the organization gains a clear, real-time view of email sending health. Operational teams receive immediate Slack alerts when bounces or complaints occur, while Kibana dashboards reveal longer-term trends. Together, these capabilities help protect sender reputation, improve deliverability, and support data-driven decisions about the email channel.
12
Let's discuss your cloud challenges and see how CloudKeeper can solve them all!
Meet the Author
No Comments Yet
Leave a Comment
Certified. Trusted. Industry Recognized.

Stop paying for cloud tools. Start paying for outcomes.

Get Started with CloudKeeper