


DevOps Engineer
Ishita is passionate about cloud computing, automation, and modern technologies. She enjoys exploring innovative solutions to improve system reliability, performance, and efficiency.


Find your cloud savings in under 5 minutes

Get a $100 reward on signup

05 Nov, 2026 | 12 Min read
An AWS bill can increase even when compute usage looks normal.
AWS EC2 instances are appropriately sized, Auto Scaling is working as expected, and there has been no major change in the infrastructure. Yet the monthly bill continues to rise.
In this situation, checking CPU and memory utilization is not enough. The increase may come from NAT Gateway processing, cross-AZ data transfer, excessive log ingestion, frequent API requests, or unused resources.
Right-sizing is still important, but it addresses only part of the problem. To understand the rest, you need to look at how the workload communicates, what it records, and which resources it continues to use. That is where a cost investigation becomes more than a review of instance sizes.
It helps to think about a workload's cost in three layers. Compute is what you provision: AWS EC2 instances, AWS ECS tasks, AWS EKS nodes. Network is how the workload moves data: across AZs, through NAT gateways, out to the internet, and between Regions. Observability is what the workload records about itself: logs, metrics, traces, and the queries you run against them.
Figure 1. Three cost dimensions to investigate beyond right-sizing
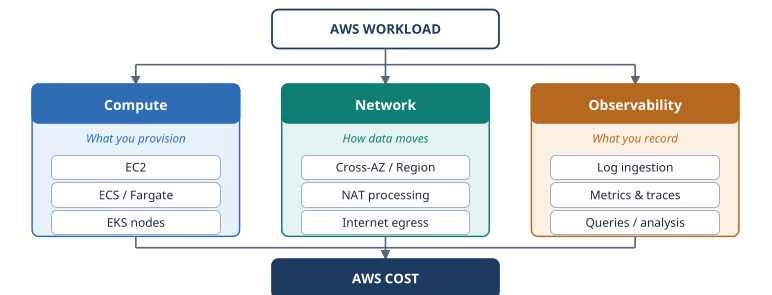
Compute reflects capacity decisions, while network and observability costs follow workload behavior.
Compute cost is driven mostly by capacity decisions. Network and observability costs are driven by behavior: traffic patterns, code paths, log levels, and architecture choices. That is why they can grow quietly while compute stays flat. The Cost Optimization pillar of the AWS Well-Architected Framework makes the same point: before you can optimize spend, you need to understand usage and attribute it to the workloads and teams that generate it.
Data-transfer costs depend on how much data moves, where the source and destination are located, and which AWS services handle the traffic.
Traffic between resources in the same Availability Zone over private IP addresses is generally not charged for data transfer. Cross-AZ and cross-Region traffic can incur additional charges, depending on the services involved and the traffic path. Internet data transfer has its own pricing rules.
Before changing an architecture to reduce these costs, identify the traffic path and check the applicable AWS pricing for your Region and services.
In practice, cross-AZ traffic comes from ordinary design decisions: an application querying a database primary in another AZ, a Kubernetes Service routing to pods in any zone, or a Kafka or OpenSearch cluster replicating across zones. Cross-Region traffic usually comes from replication, DR backup copies, or a service calling a bucket or API in another Region.
Figure 2. Cross-AZ data transfer
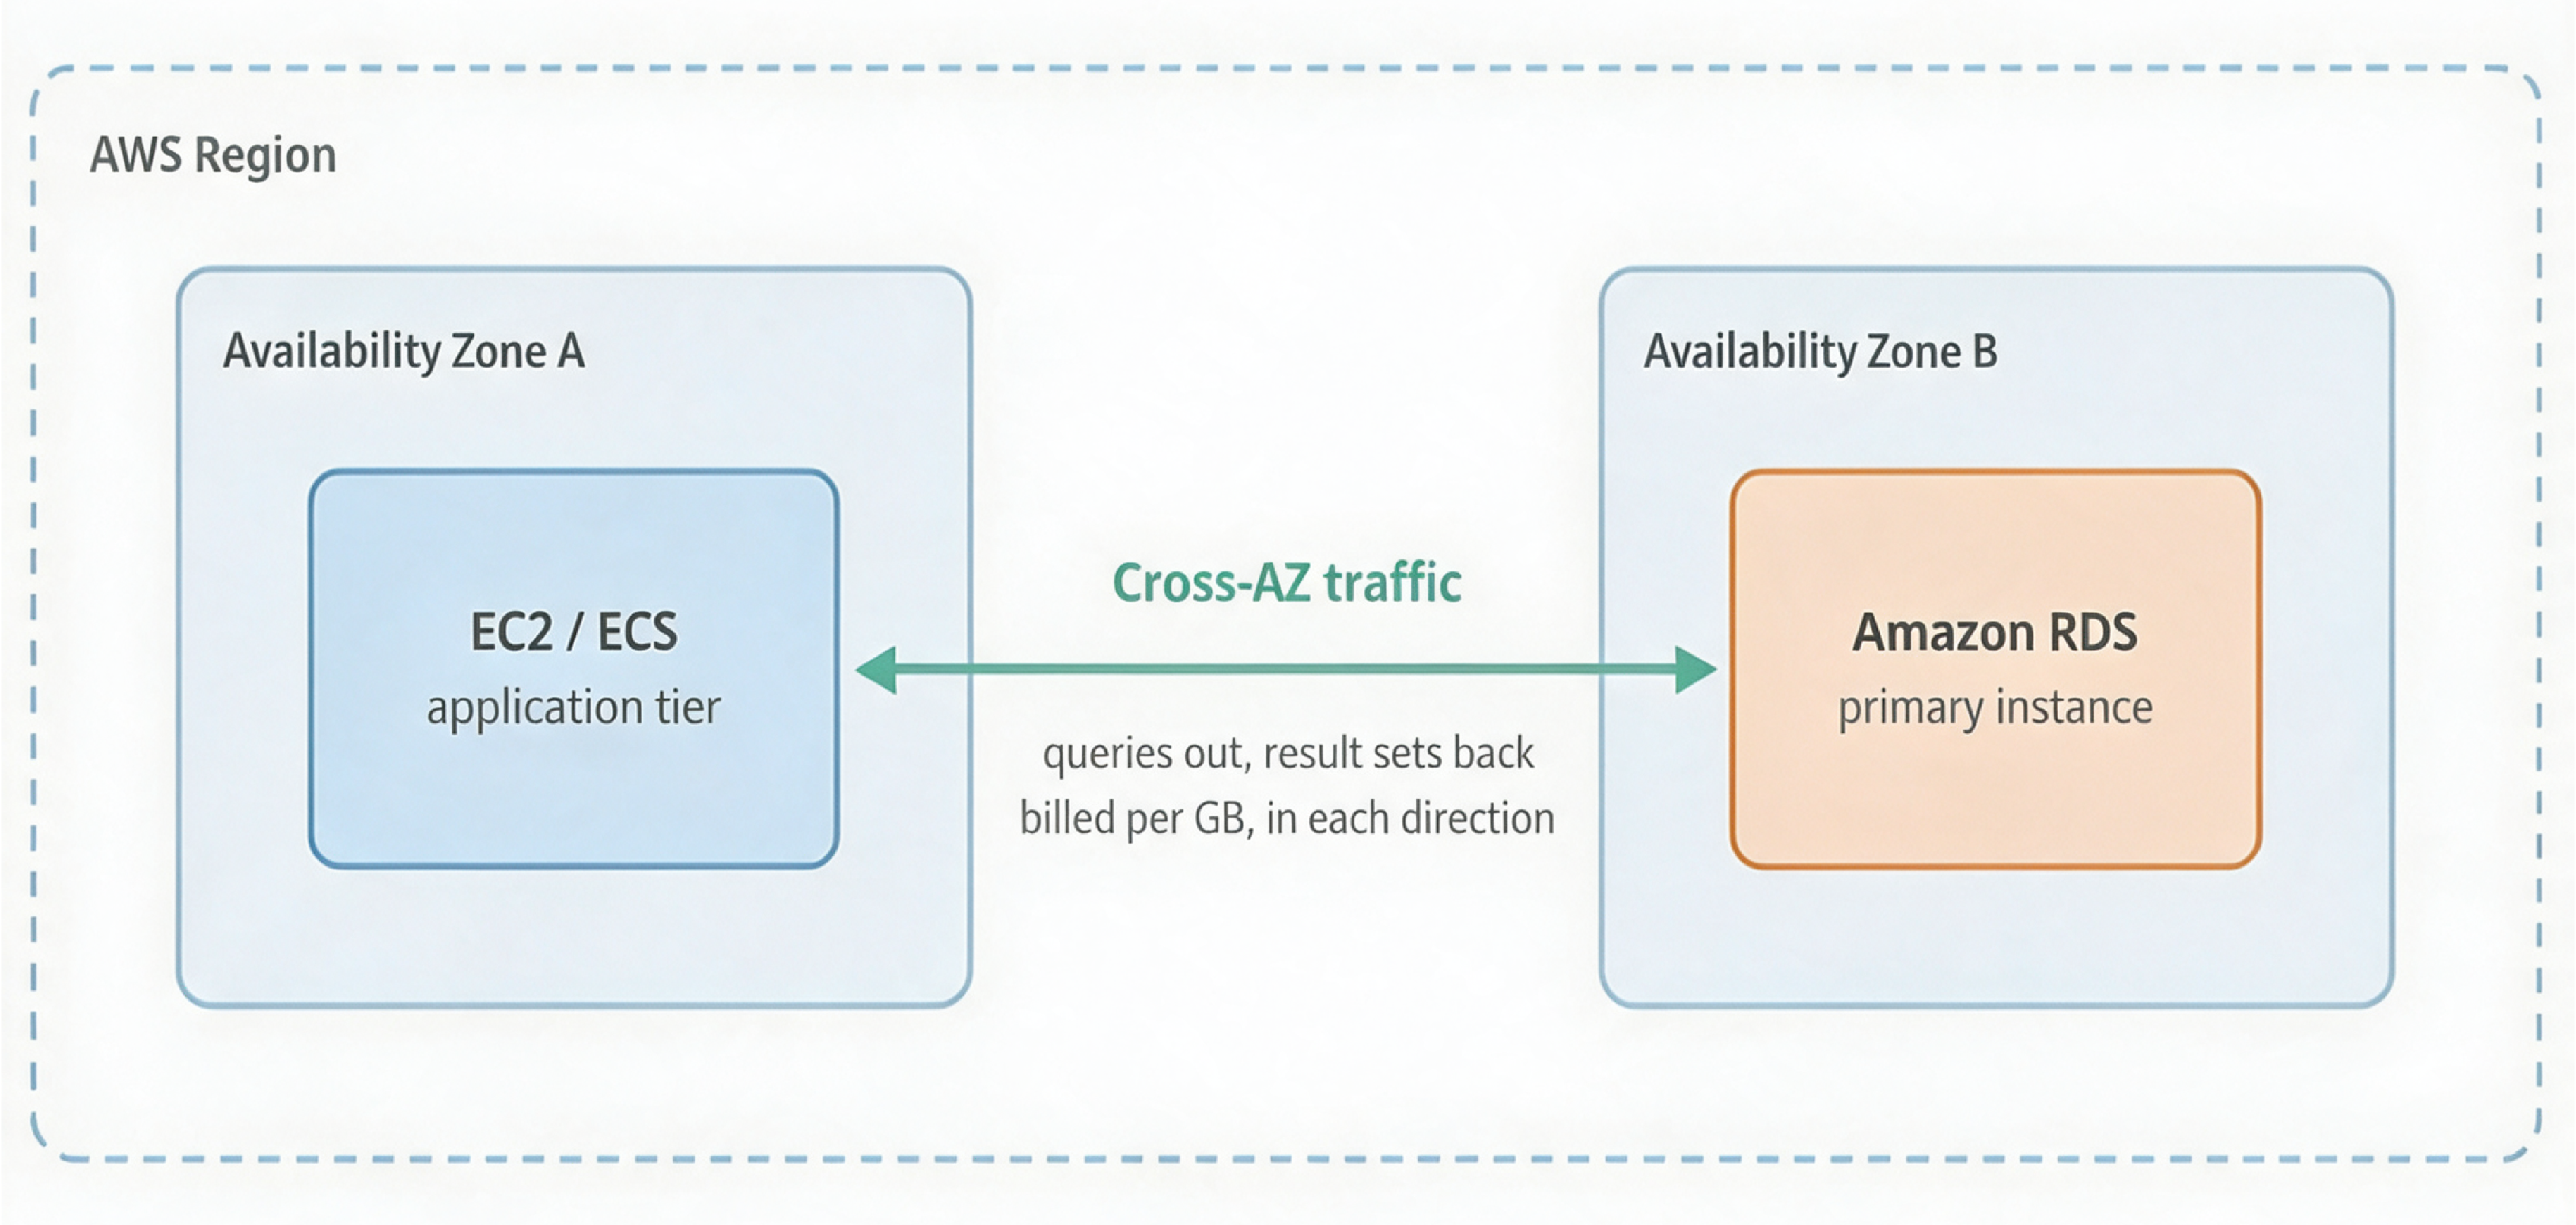
In this example, the application and the database primary are in different Availability Zones, so their query and response traffic crosses an AZ boundary. In a real deployment, the amount of cross-AZ traffic depends on application placement, routing, and database topology.
Cross-AZ data-transfer charges depend on the services involved and the path the traffic takes. For Amazon RDS Multi-AZ deployments, replication traffic between the primary and standby does not incur additional data-transfer charges. Application traffic between AWS EC2 and RDS across Availability Zones can incur regional data-transfer charges on the EC2 side. These are different traffic paths and should be investigated separately.
The goal is not to collapse everything into one AZ. Multi-AZ deployments provide resilience, and that resilience has real value. Instead, investigate traffic that is avoidable or unexpected. For read-heavy workloads, a read replica closer to the application may reduce cross-AZ traffic. Before introducing one, compare the potential savings against additional compute and storage costs, replication lag, and application consistency requirements. Topology-aware routing may also help keep suitable service calls local without compromising availability.
Private subnets are the right default for most workloads. But when a workload in a private subnet needs to reach something outside the Virtual Private Cloud, such as an external API, a package repository, or the public endpoint of an AWS service, that traffic typically goes through a NAT gateway. A NAT gateway is charged for every hour it is available and for every gigabyte of data it processes.
NAT Gateway processing costs can increase significantly when workloads transfer large volumes of data. For example, workloads pulling container images from Amazon ECR, exporting data to Amazon S3, or accessing AWS services through public endpoints may send traffic through a NAT Gateway.
If the workload and NAT Gateway are in different Availability Zones, additional cross-AZ data-transfer charges may apply. The actual charges depend on the traffic path and the services involved.
Figure 3. NAT gateway path vs. VPC endpoint path
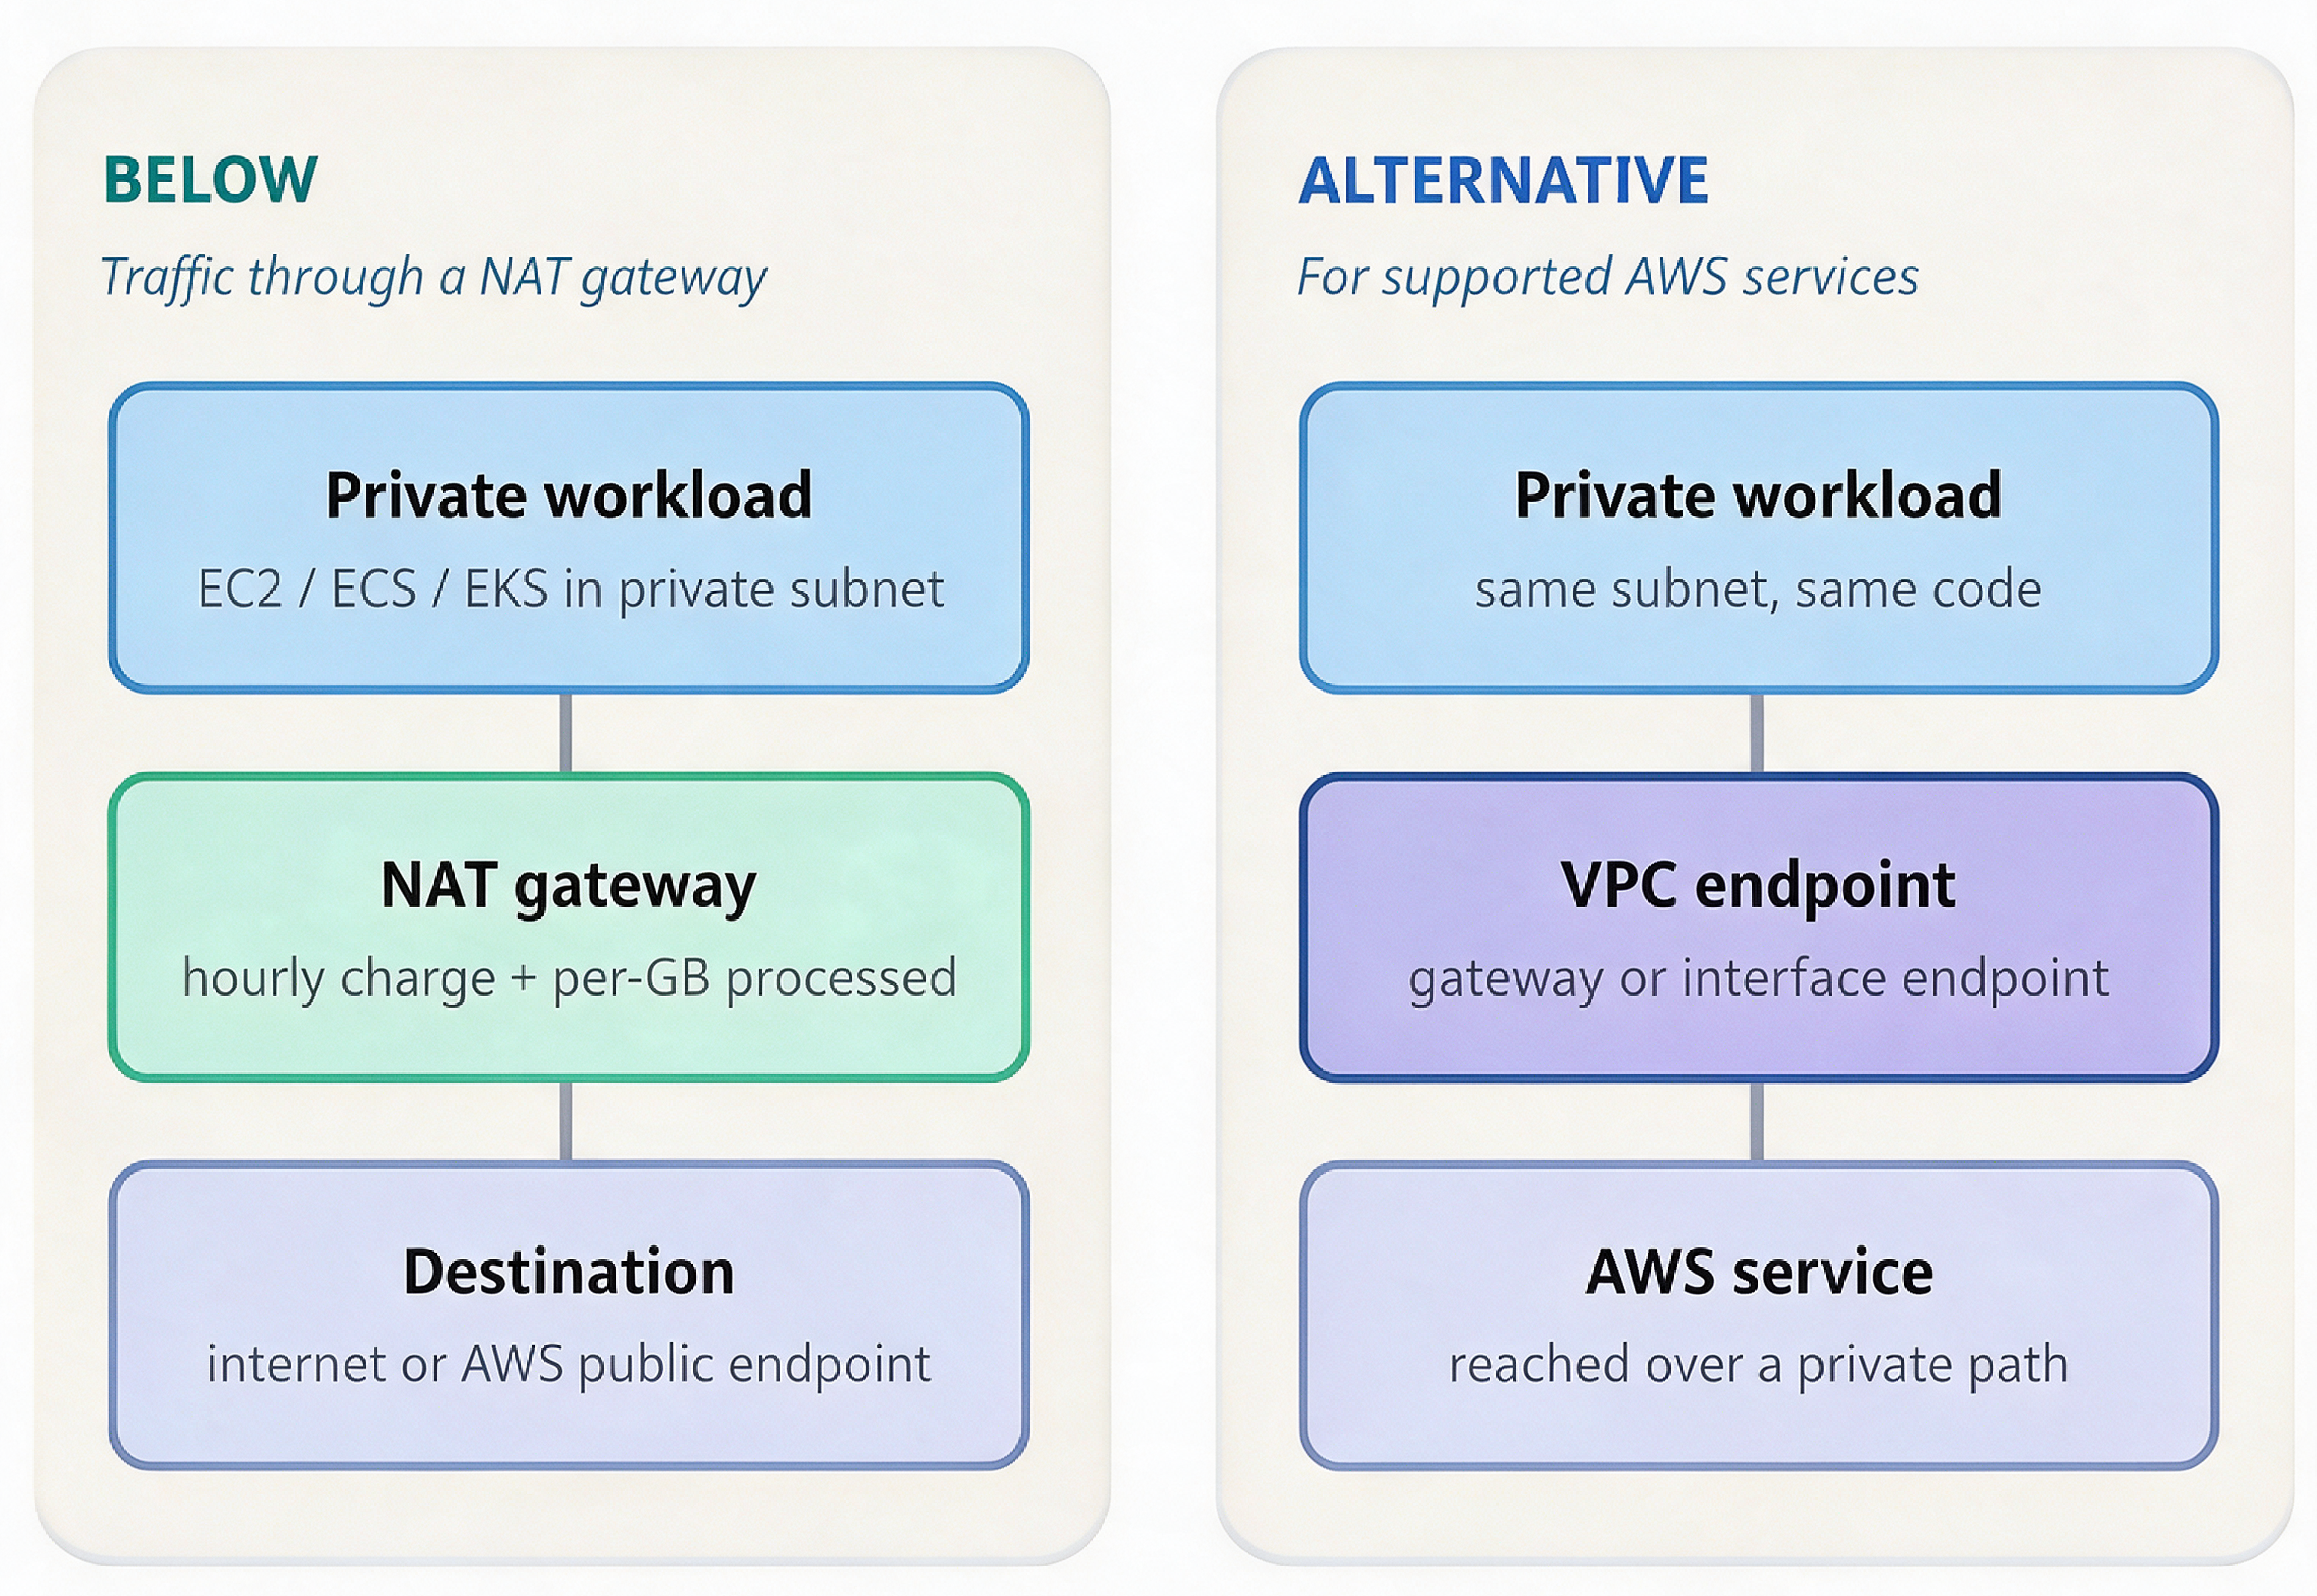
For supported AWS services, a VPC endpoint can remove NAT processing from the path, but interface endpoints carry their own charges.
For supported services, VPC endpoints provide a private path that skips the NAT gateway. Gateway endpoints are available for AWS S3 and DynamoDB, and AWS does not charge extra for them. Interface endpoints, built on AWS PrivateLink, support many more services, but each one has an hourly charge for every AZ it is deployed in, plus a per-GB data processing charge.
So VPC endpoints are not automatically cheaper. An AWS S3 gateway endpoint in a VPC with heavy AWS S3 traffic is usually an easy decision. An interface endpoint for a low-traffic service, deployed across three AZs in several VPCs, can cost more than the NAT traffic it replaces. The outcome depends on traffic volume, endpoint type, the number of AZs and VPCs, and Regional pricing. Start by reviewing NAT Gateway CloudWatch metrics, including BytesOutToDestination and BytesOutToSource, to understand traffic volume in both directions. Use VPC Flow Logs to investigate the source and destination of the traffic.
Then compare these findings with the corresponding NAT Gateway usage in Cost Explorer or your Cost and Usage Report. Avoid adding all NAT byte counters together, because doing so can double-count traffic.
For workloads pulling images from Amazon ECR, review the ECR API and Docker registry interface endpoints, along with the S3 gateway endpoint used to access image layers. The required endpoint configuration depends on the image access path and network setup.
Logging cost grows in three places. Ingestion is charged as data is sent to AWS CloudWatch Logs. Storage accumulates over time, and by default a log group keeps data indefinitely unless you set a retention period. Analysis adds more: CloudWatch Logs Insights charges based on the amount of data each query scans, so broad queries over noisy log groups get expensive quickly.
Logging costs often grow through small changes that go unnoticed. Debug logging may remain enabled after an incident, request and response bodies may be recorded on every call, or health checks may generate repetitive log entries from every running task.
Review these patterns alongside ingestion volume, storage retention, and query activity to identify where logging can be made more efficient without losing information needed for troubleshooting or compliance.
Figure 4. Separating log groups by purpose and retention requirements
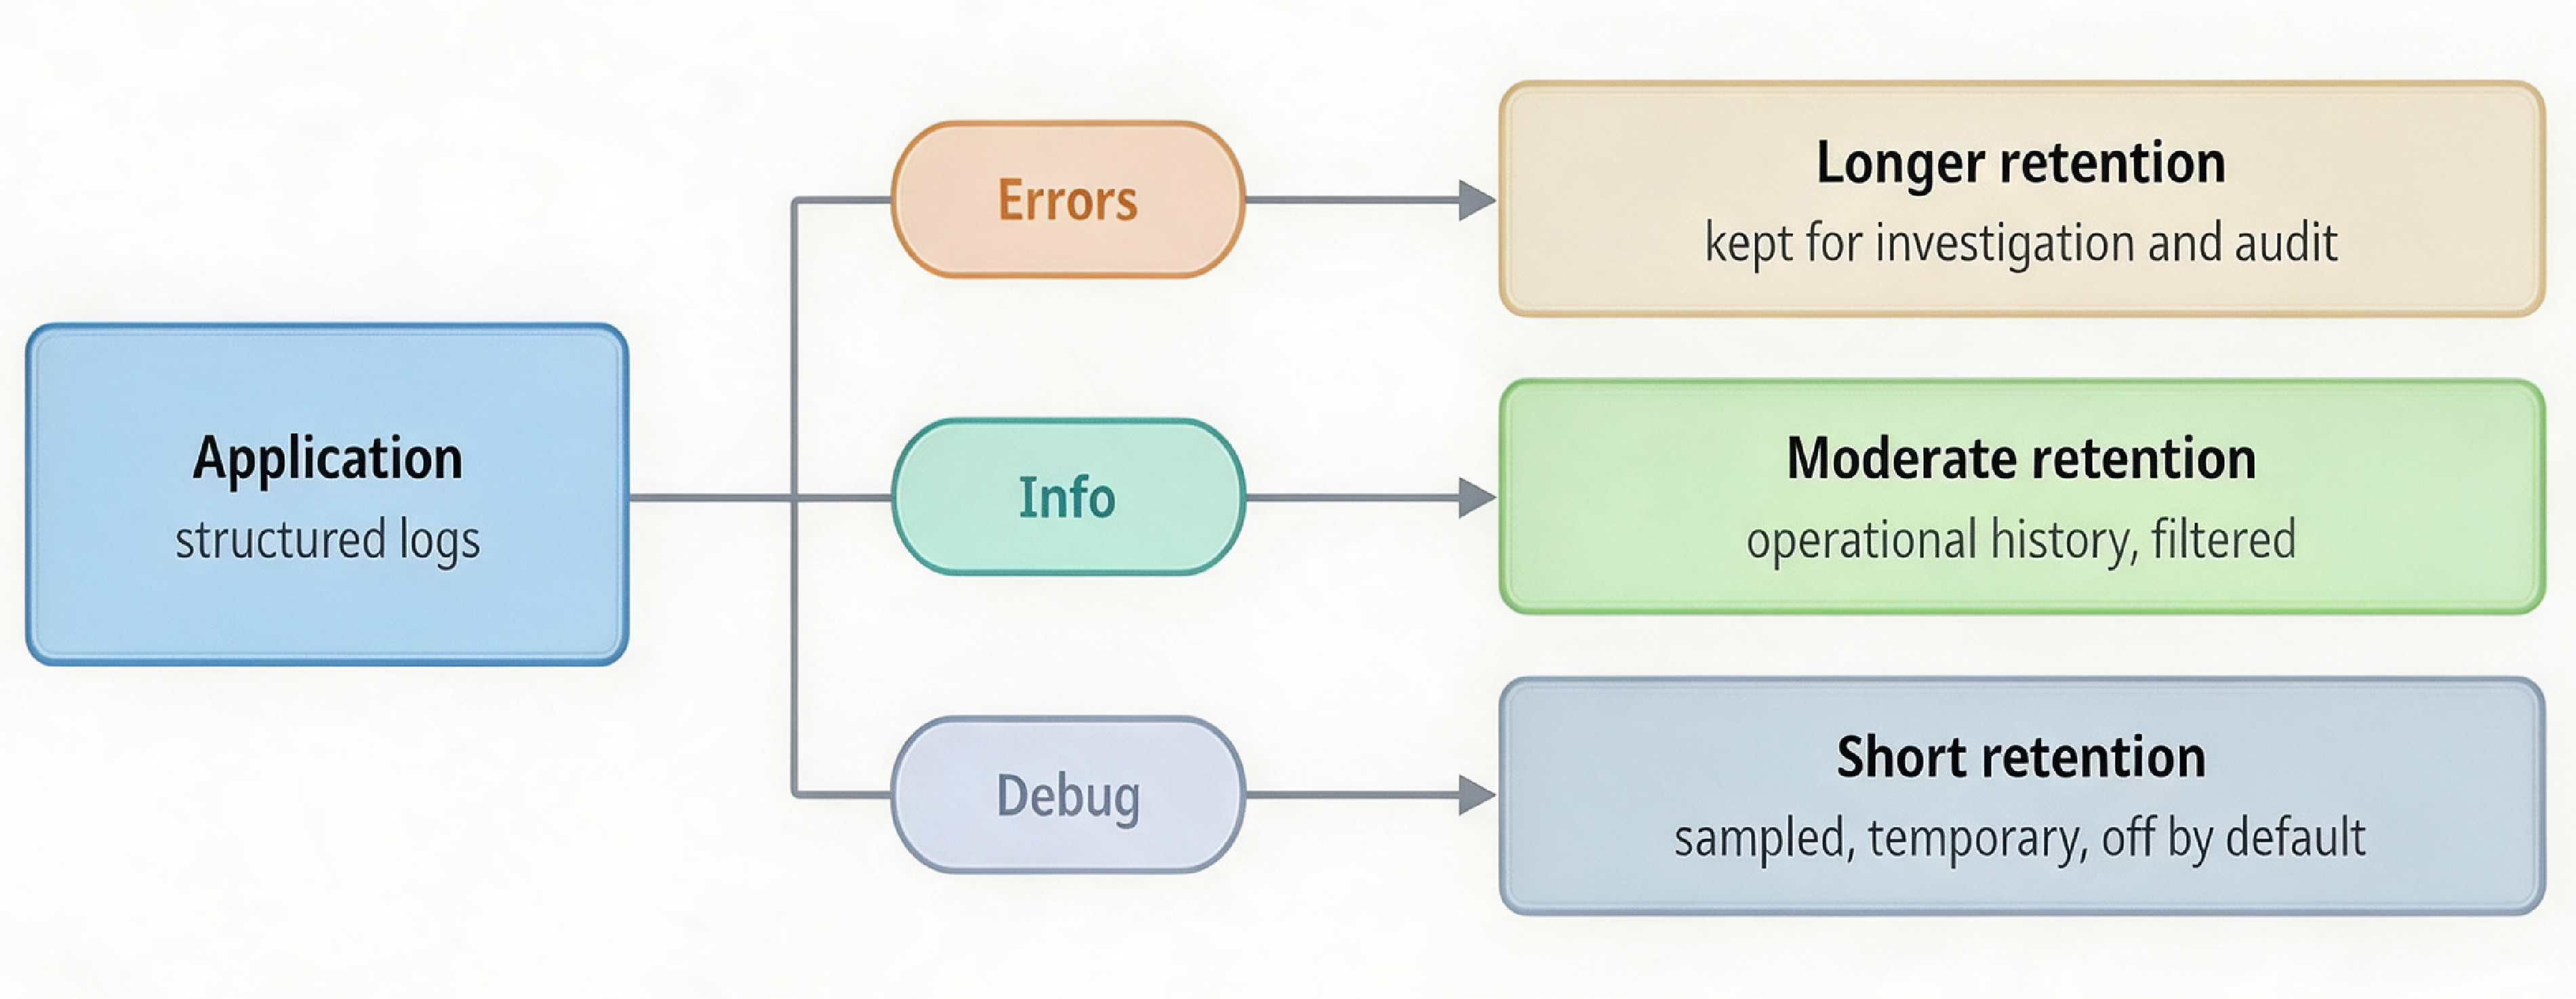
Separate log groups allow retention to be configured according to operational, security, and compliance requirements.
Logs should have a clear operational, security, or compliance purpose. Review what is being recorded, how frequently it is generated, and how long it needs to be retained.
Configure retention at the log-group level. Where different retention periods are needed, route log categories to separate groups or storage destinations. For high-volume debug logs, consider filtering or sampling unnecessary events before ingestion.
For logs that are accessed infrequently, compare AWS CloudWatch Logs Infrequent Access with Standard and with exporting suitable data to AWS S3. Infrequent Access has different feature support, so check whether the querying and monitoring capabilities your team needs are available before choosing it. Compare ingestion, storage, and query costs rather than making the decision on ingestion price alone.
Many AWS services charge per request or per unit of work. The unit price is small, which is exactly why it gets ignored.
Small unit cost × very high volume = significant cost
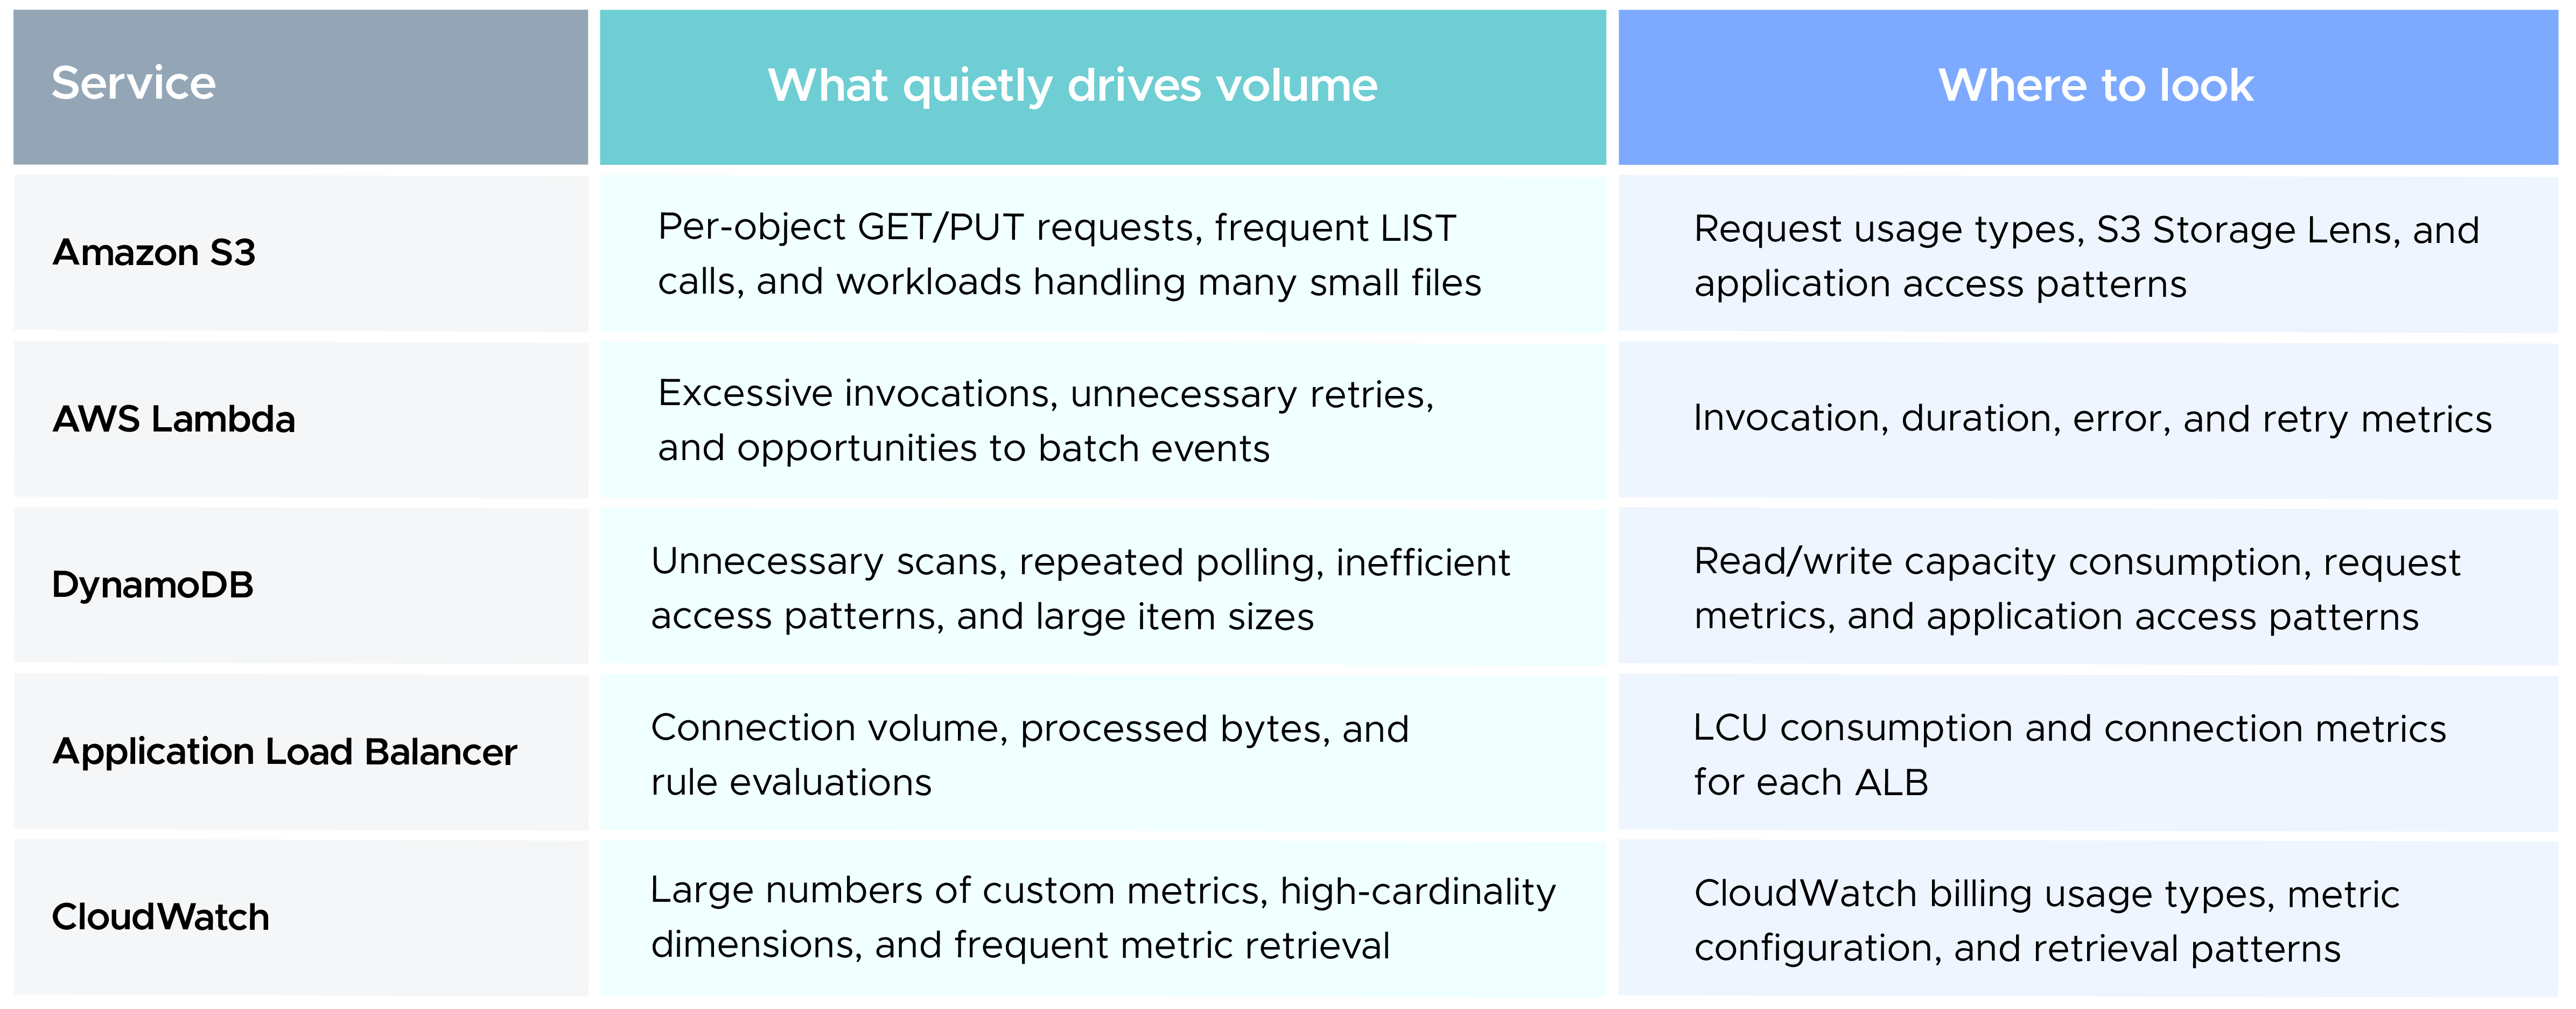
Projection expressions can reduce response payload size in DynamoDB, but returning fewer attributes does not by itself reduce the read capacity consumed for the same items.
Custom metric charges and metric-retrieval API charges should be investigated separately. CloudTrail can help identify relevant API activity when the necessary events are recorded, but event counts do not directly translate into AWS CloudWatch charges.
In AWS Cost Explorer, group charges by service and usage type to distinguish request-related costs from storage or compute costs. If request charges increase faster than workload traffic, investigate application code, retry behavior, polling intervals, and integrations that may be generating unnecessary requests.
One external request to Service A triggers calls to B and C, and each of those calls another service. Real systems often fan out wider once retries, auth checks, and config lookups are added.
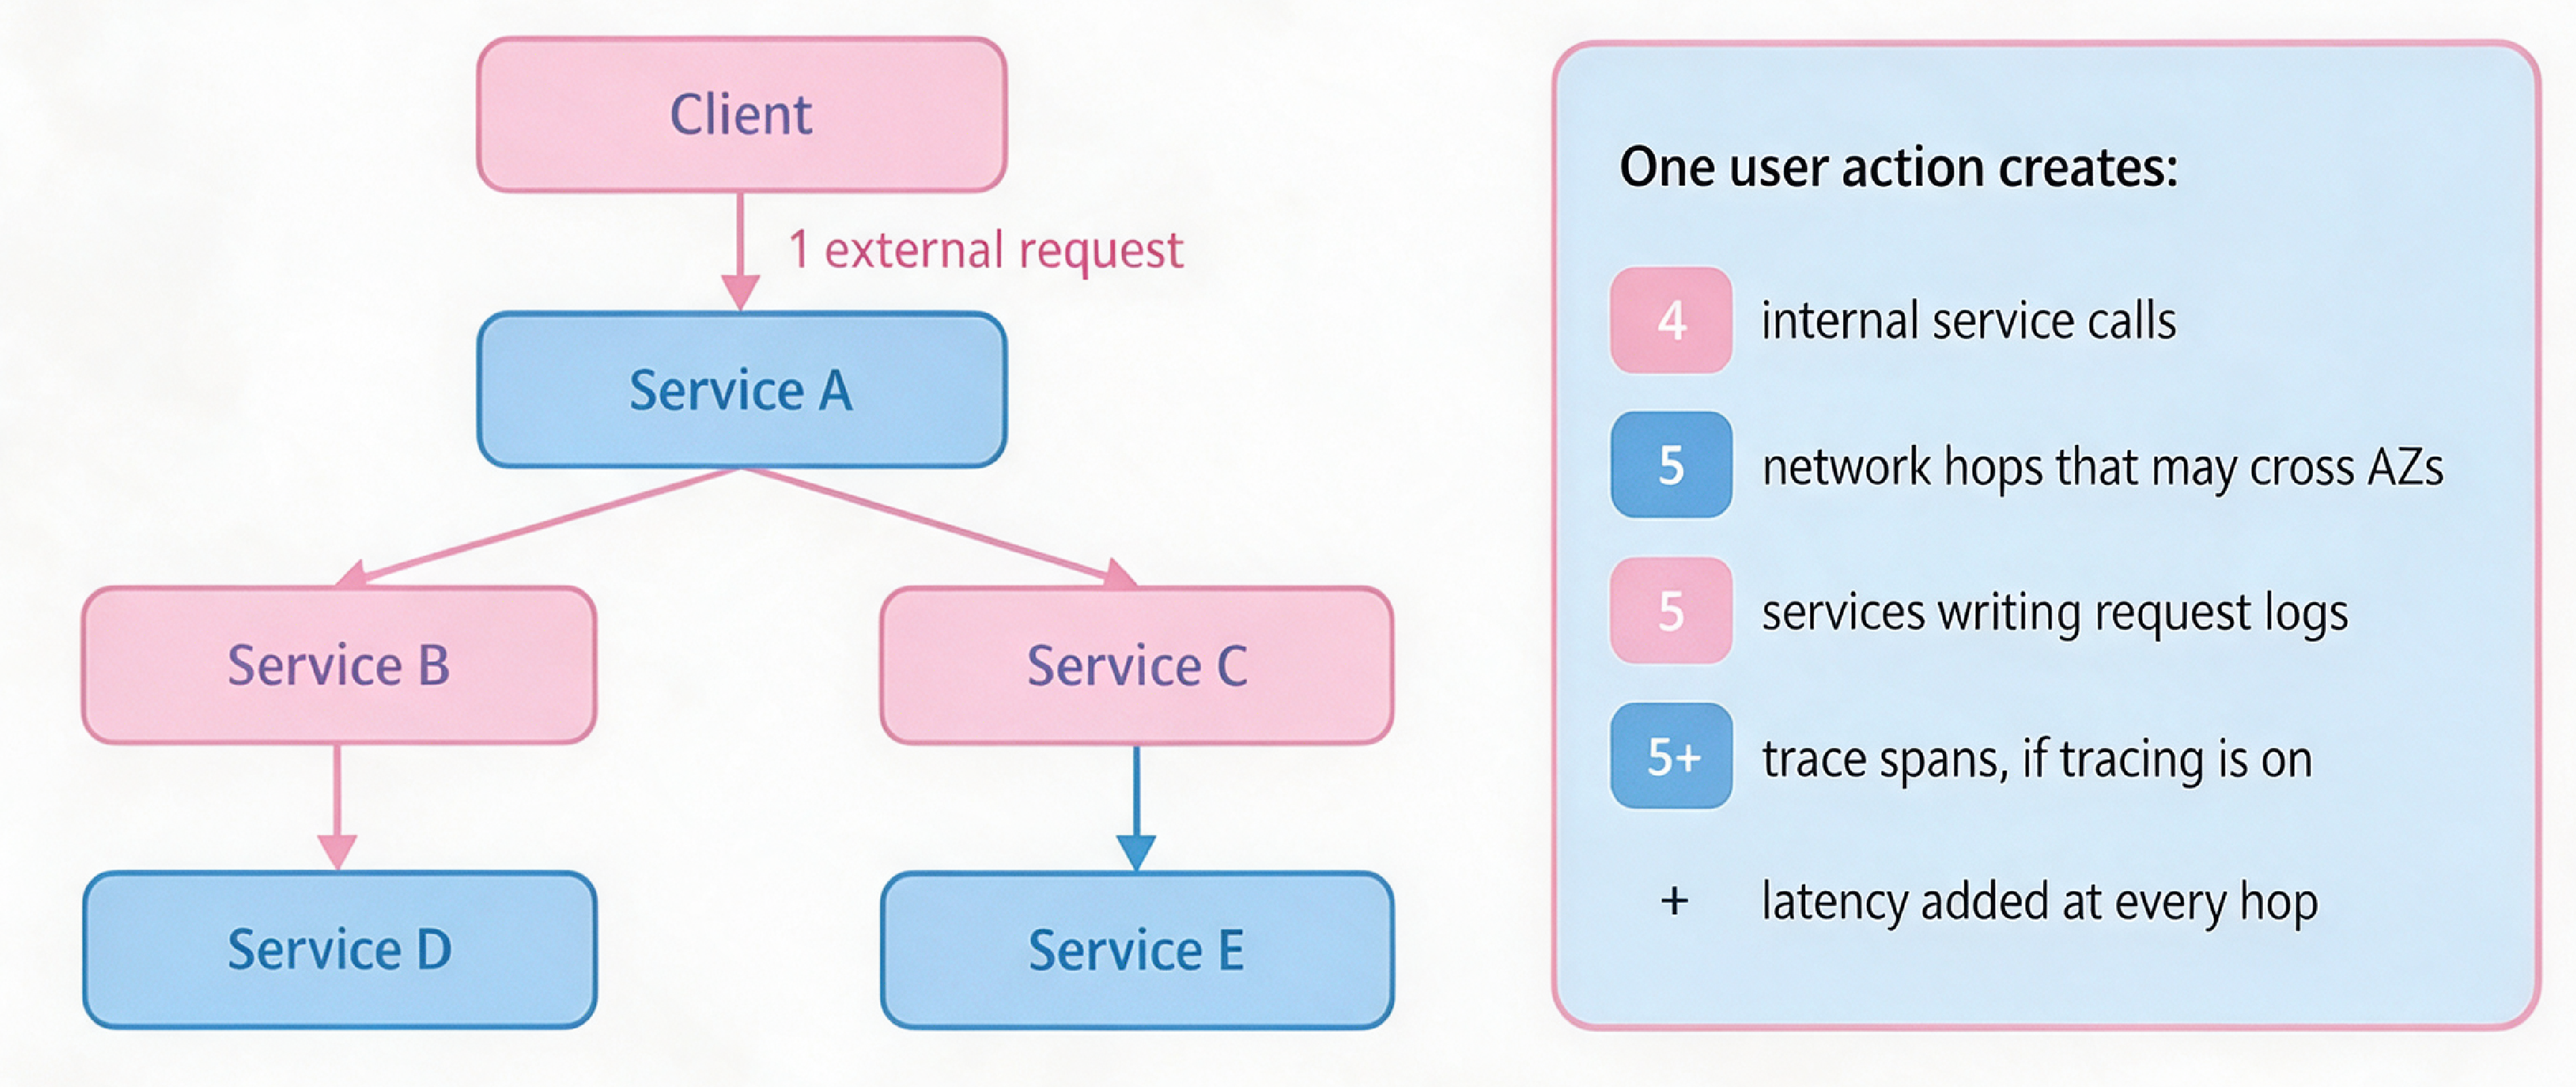
One user action creates:
A single external request can multiply into several internal calls, each adding network, logging, tracing, and latency overhead.
Each additional service call can generate network traffic, logs, and trace data. Depending on the architecture, calls may also pass through internal load balancers or service-mesh proxies. When latency increases, teams should investigate the source of the delay before adding capacity, because more compute does not necessarily resolve a network or application-level bottleneck.
Microservices are not inherently wasteful. The problem is allowing unnecessary service-to-service calls to grow unnoticed. Distributed tracing with AWS X-Ray or OpenTelemetry can help identify which requests trigger the most downstream activity.
Depending on the findings, caching, batching, or reducing repeated calls may improve both latency and cost. Where practical, same-AZ routing between service replicas can reduce cross-AZ traffic without sacrificing multi-AZ resilience.
Most forgotten resources follow the same lifecycle:
Resource needed → Created → Used → Project completed → Resource forgotten → Monthly cost continues
Typical examples: stopped EC2 instances whose AWS EBS volumes are still billed; unattached AWS EBS volumes left behind after termination; snapshots and AMIs from releases nobody will roll back to; load balancers with no healthy targets; NAT gateways in VPCs of retired environments; test AWS RDS instances created for a one-off migration; and CloudWatch log groups for Lambda functions that no longer exist. Public IPv4 addresses also carry an hourly charge, whether or not they are attached.
Every resource should have an owner, an environment, and, where appropriate, a project or expiry tag. Validate required tags in infrastructure-as-code workflows and deployment pipelines.
Use AWS Organizations tag policies to standardize supported tag keys and values, and AWS Config rules such as required-tags to identify resources with missing or incorrect tags. If preventive enforcement is required, choose an appropriate control for the resource and creation workflow rather than relying on AWS Config alone.
Activate the relevant user-defined cost allocation tags for billing analysis. Review untagged or ownerless resources regularly, and include resource cleanup in every project's exit checklist.
When costs rise, avoid jumping straight to "what can we cut?". Follow the bill down to the change that caused it, using the workflow in Figure 6.
In AWS Cost Explorer, compare the current period with the previous one, grouped by service. Then filter to the service that moved and group by usage type. This step matters: the "AWS EC2-Other" line can include AWS EBS volumes, snapshots, NAT gateway hours and processing, data transfer, and idle Elastic IPs. The usage type tells you which one actually changed.
Configure Cost and Usage Reports 2.0 with resource-level detail where supported, and activate the relevant cost allocation tags. Query the export with Amazon Athena to identify the account, usage type, and resource responsible for a charge where resource-level identifiers are available. When resource-level attribution is unavailable, correlate billing records with AWS CloudWatch metrics, VPC Flow Logs, deployment history, and resource configuration to narrow down the cause.
Figure 6. AWS cost investigation workflow
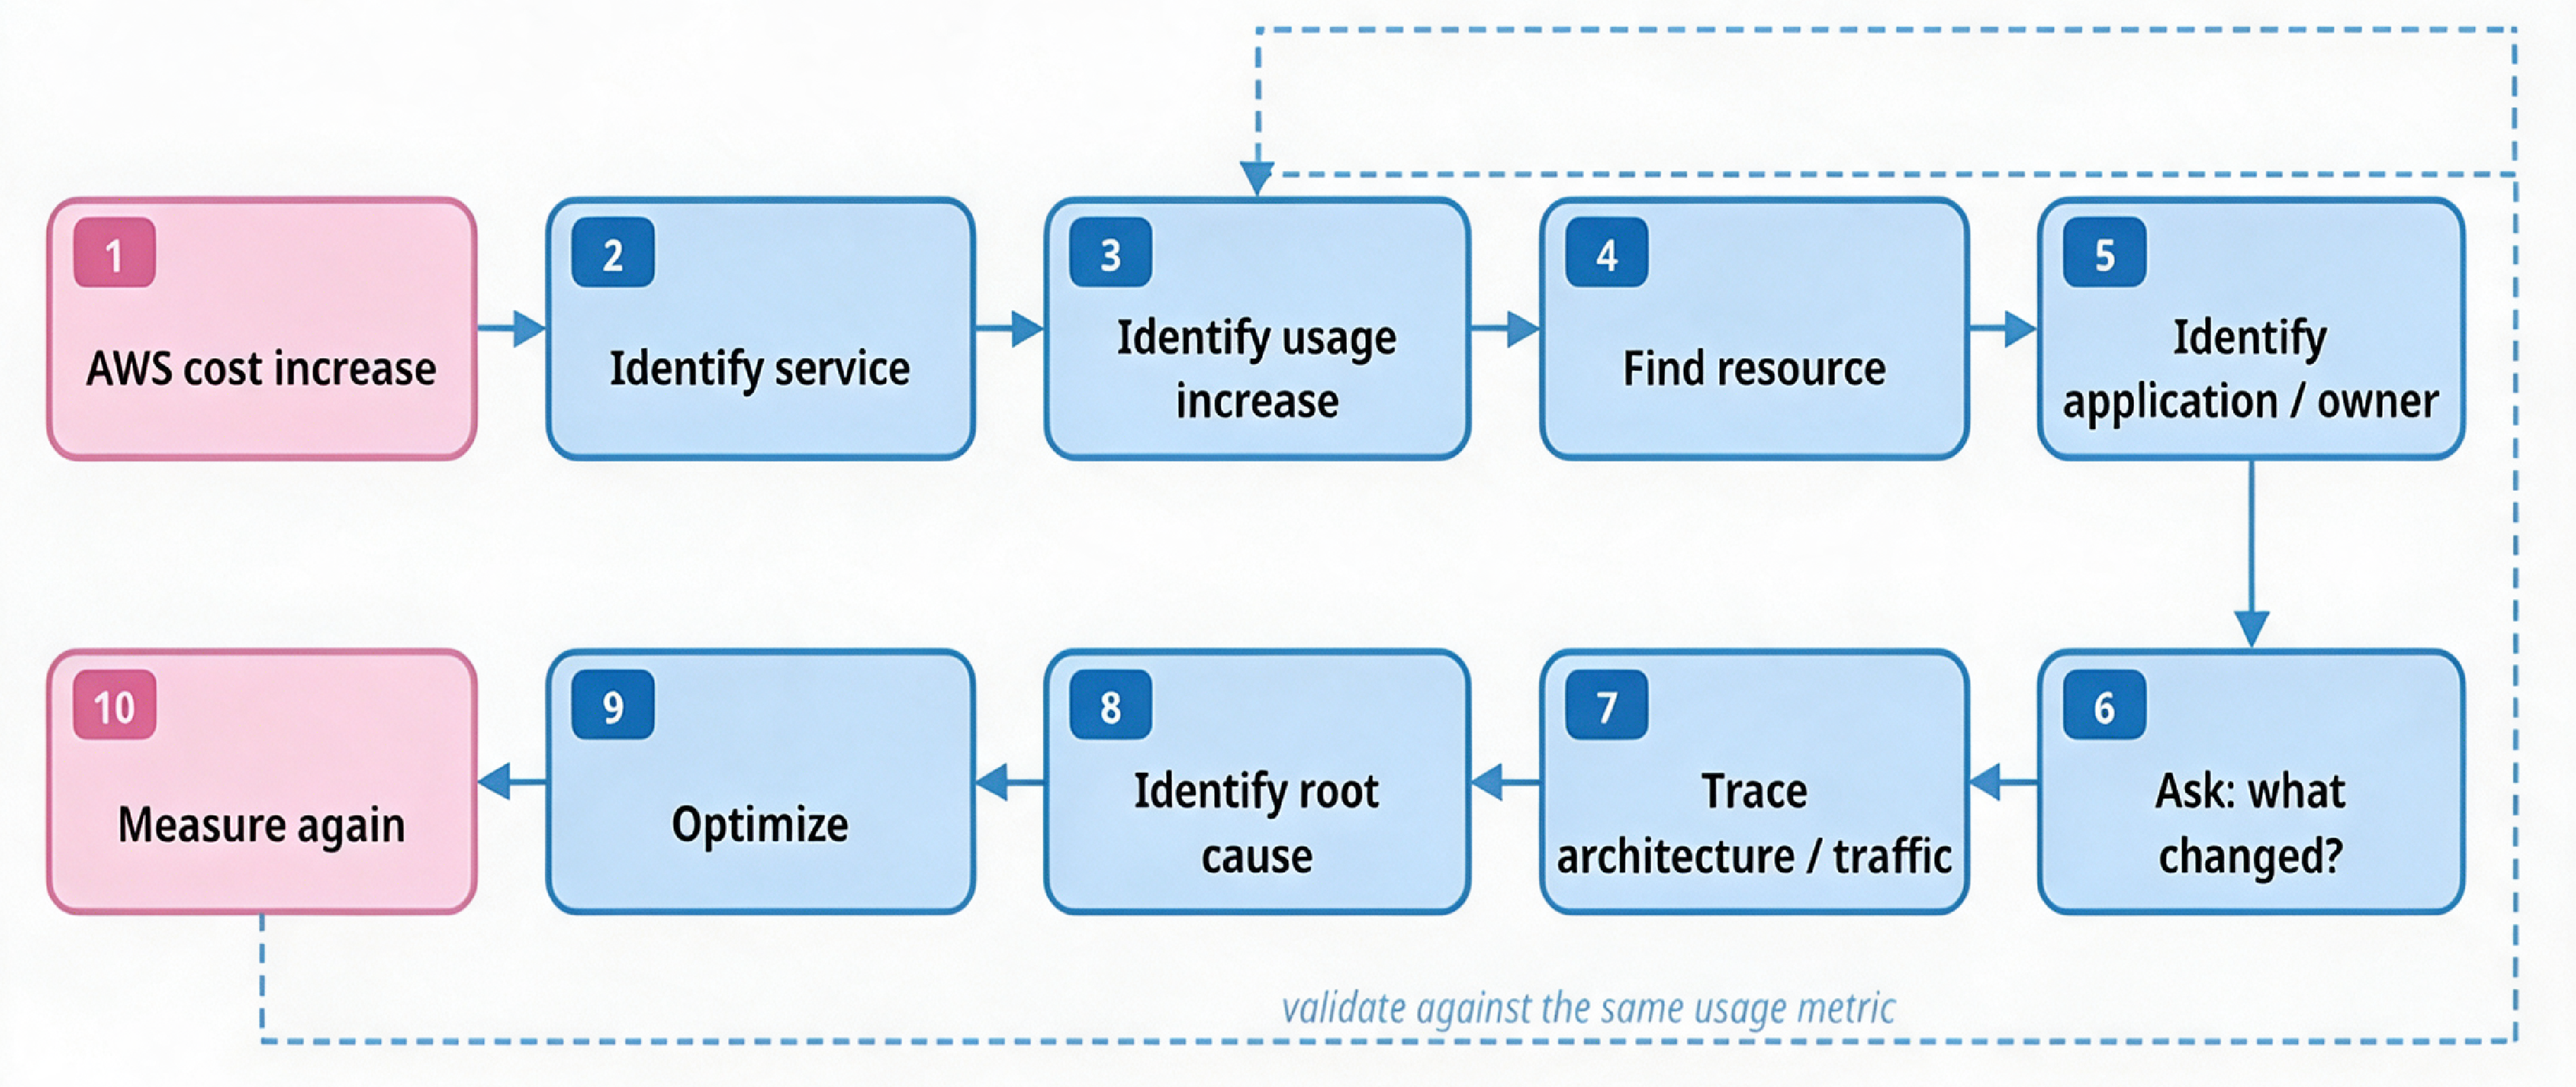
Start with the billing increase, identify the usage type and likely cause, and validate the optimization using the same relevant metrics before and after the change.
This scenario is fictional, but it reflects a pattern that is common in real environments. A platform team runs several services on Amazon EKS across three AZs, backed by Amazon RDS for PostgreSQL and Amazon S3. The monthly bill rises unexpectedly, and nobody can point to a reason.
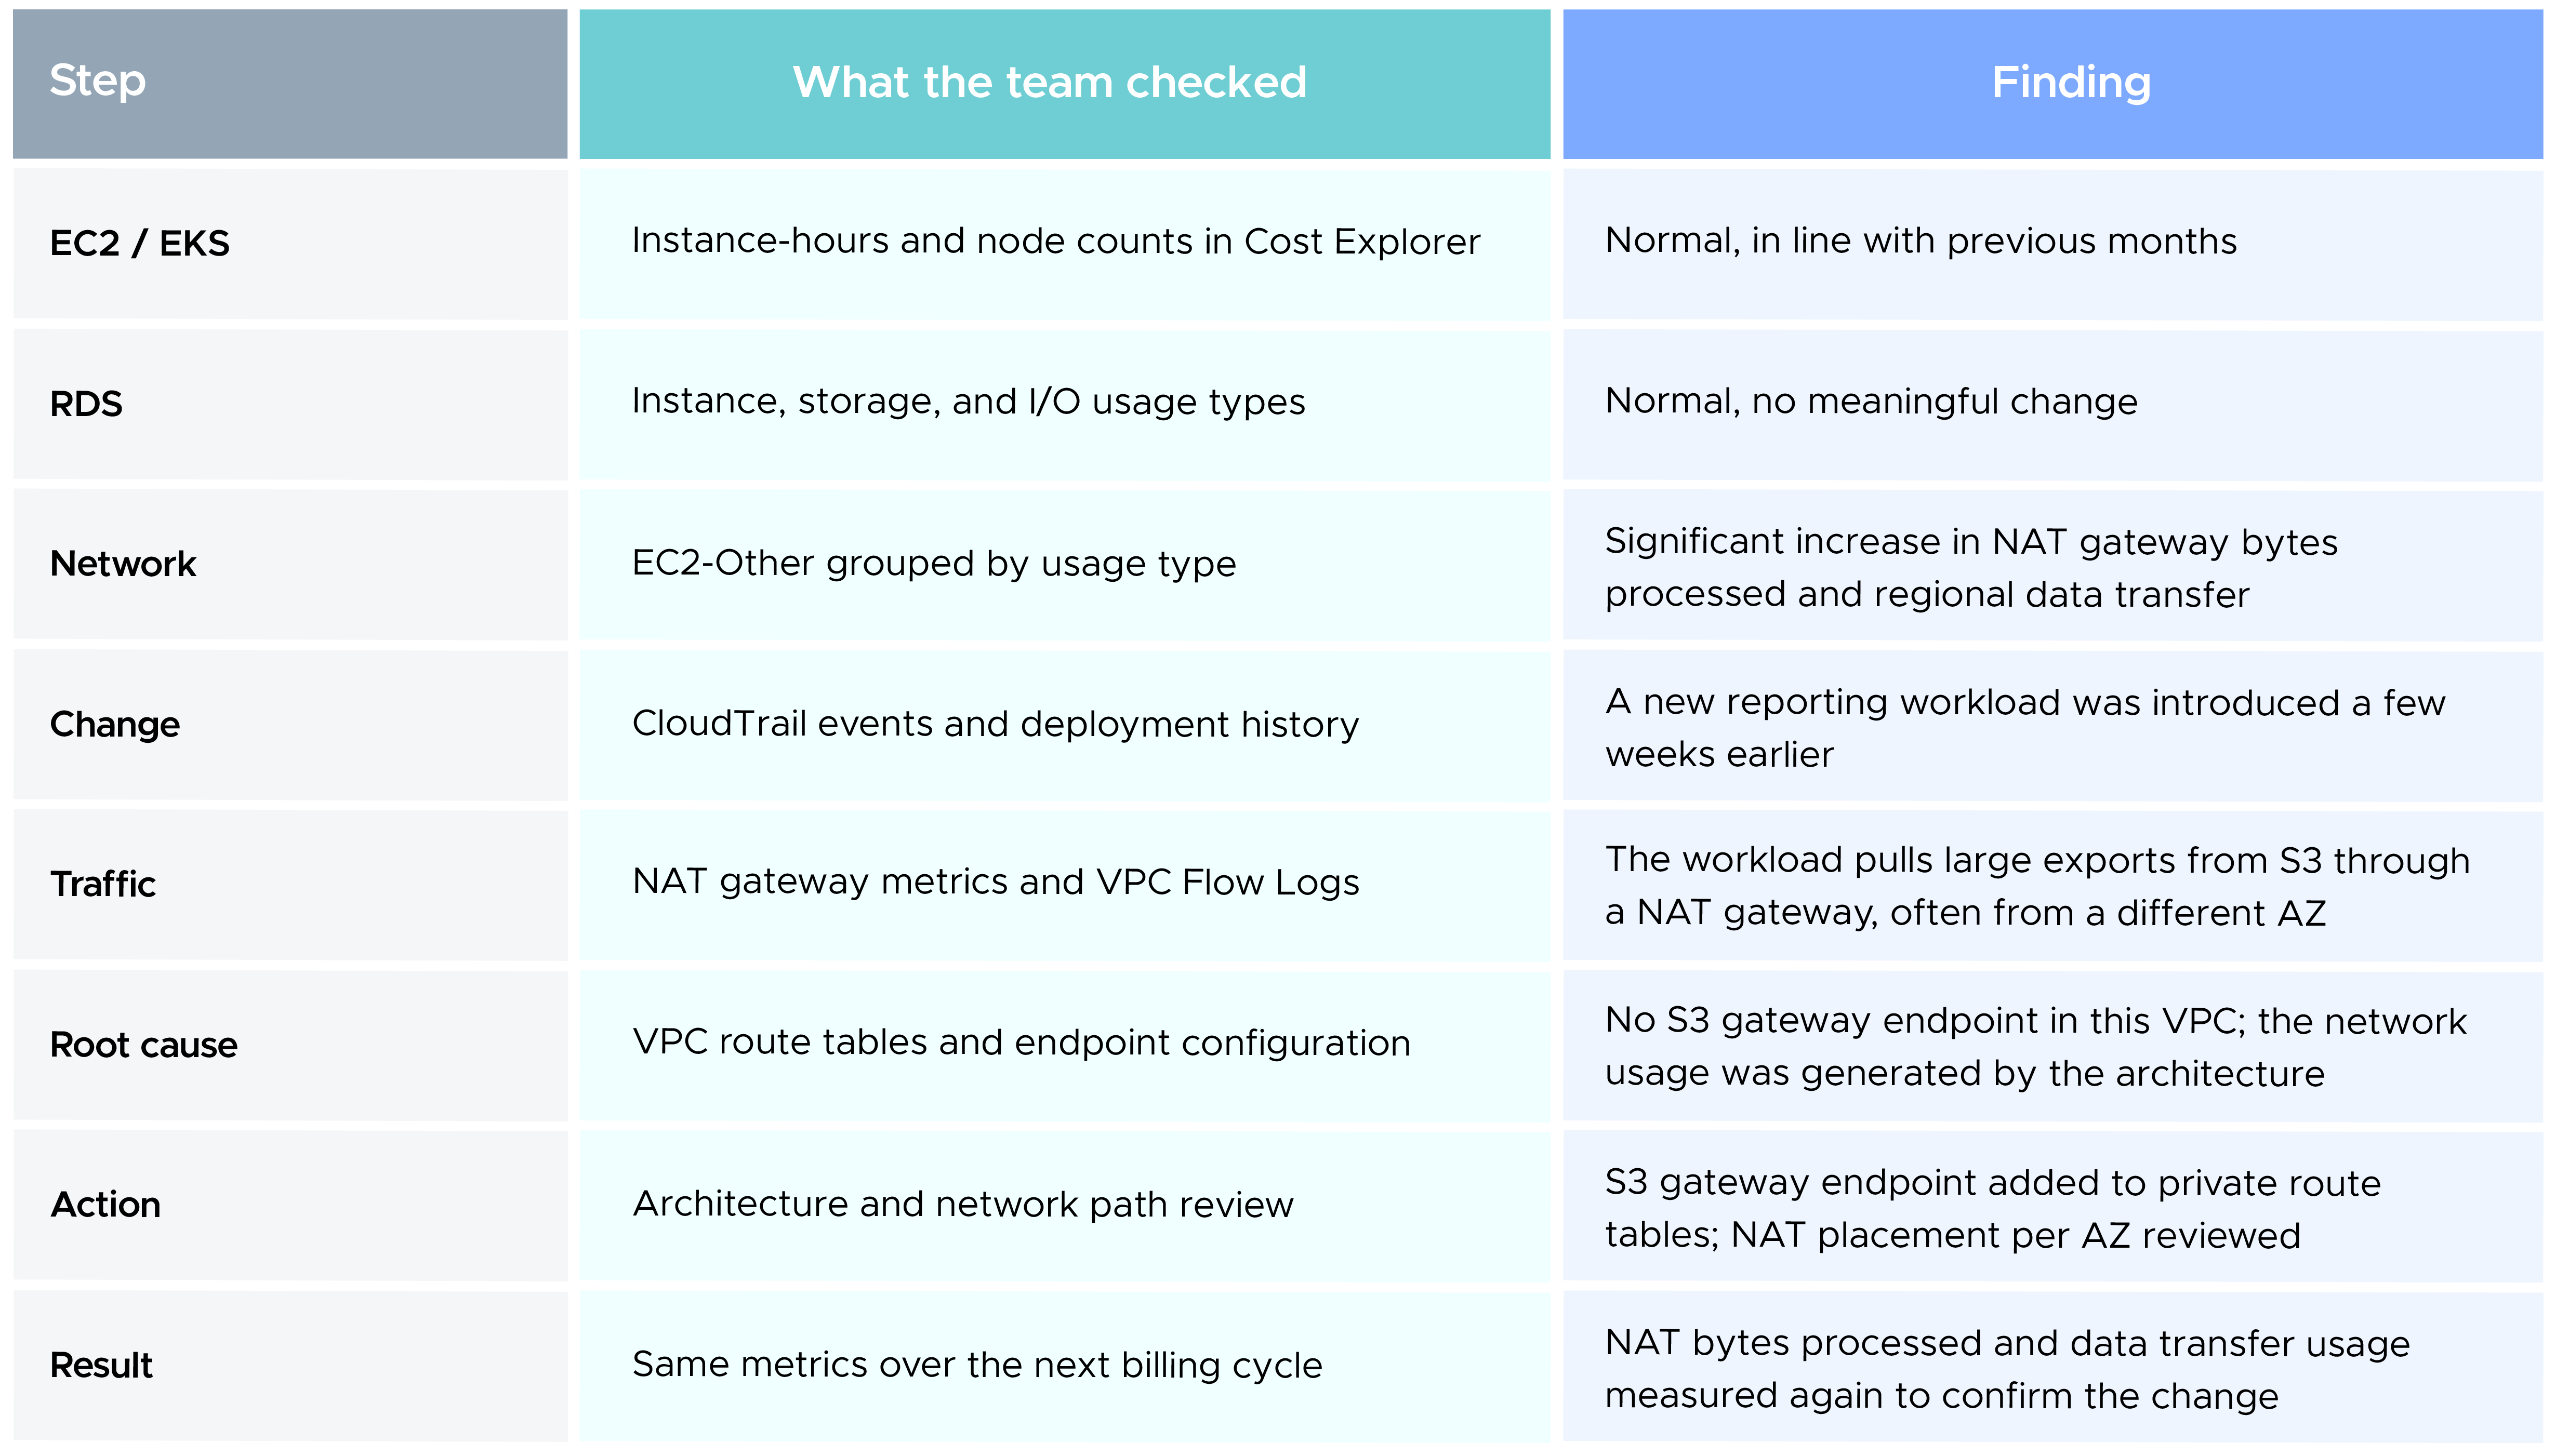
Notice what the team did not do. They did not shrink instances or remove Multi-AZ. The waste lived in the network path, created by an architectural gap, and the fix was a routing change backed by measurement.
The cheapest time to fix a cost problem is before it is deployed. Cost belongs in the design review:
Requirements → Architecture → Performance + Reliability + Security + Cost → Deploy → Measure → Optimize
Cost optimization should not mean blindly removing infrastructure. Dropping a standby database, cutting log retention below a compliance requirement, or consolidating to a single NAT gateway may lower the bill while raising risk. The goal is to make sure every dollar of spend is intentional and provides meaningful technical or business value. Trade-offs are expected; they should simply be deliberate.
Right-sizing still matters, but it only covers what you provision. Hidden waste lives in how workloads behave: the paths their data takes, the logs they write, the requests they make, and the resources they leave behind. Finding it means following the usage until the architecture explains it.
The cheapest AWS architecture is not necessarily the one with the fewest resources. It is the one where costs are understood, intentional, measurable, and aligned with the value the system provides.
Right-sizing remains an important part of AWS cost optimization, but it is not the whole picture.
When a bill increases unexpectedly, look beyond compute utilization. Check where data is moving, how much traffic passes through NAT Gateways, whether logging and request volumes are growing, and which resources are no longer needed.
Use billing data to identify the increase, operational telemetry to investigate it, and before-and-after measurements to validate the change. The goal is not to build the smallest possible infrastructure. It is to understand what you are paying for and make sure the cost is justified by the workload's requirements for performance, reliability, and security.
99% of companies saved up to 15% monthly with this plan & achieved peak performance.